
Greenpeppersoftware

Deep dives into software, hardware, and the ideas reshaping how we build things.

The Three Pipeline Principles That Actually Matter (And Why Most Teams Get Them Wrong)

Fast Feedback Loops Beat Perfect Coverage Every Time

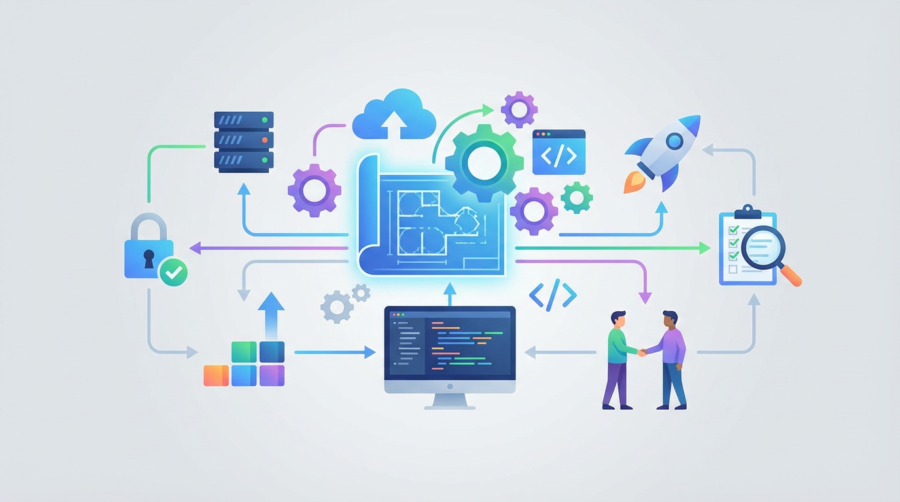
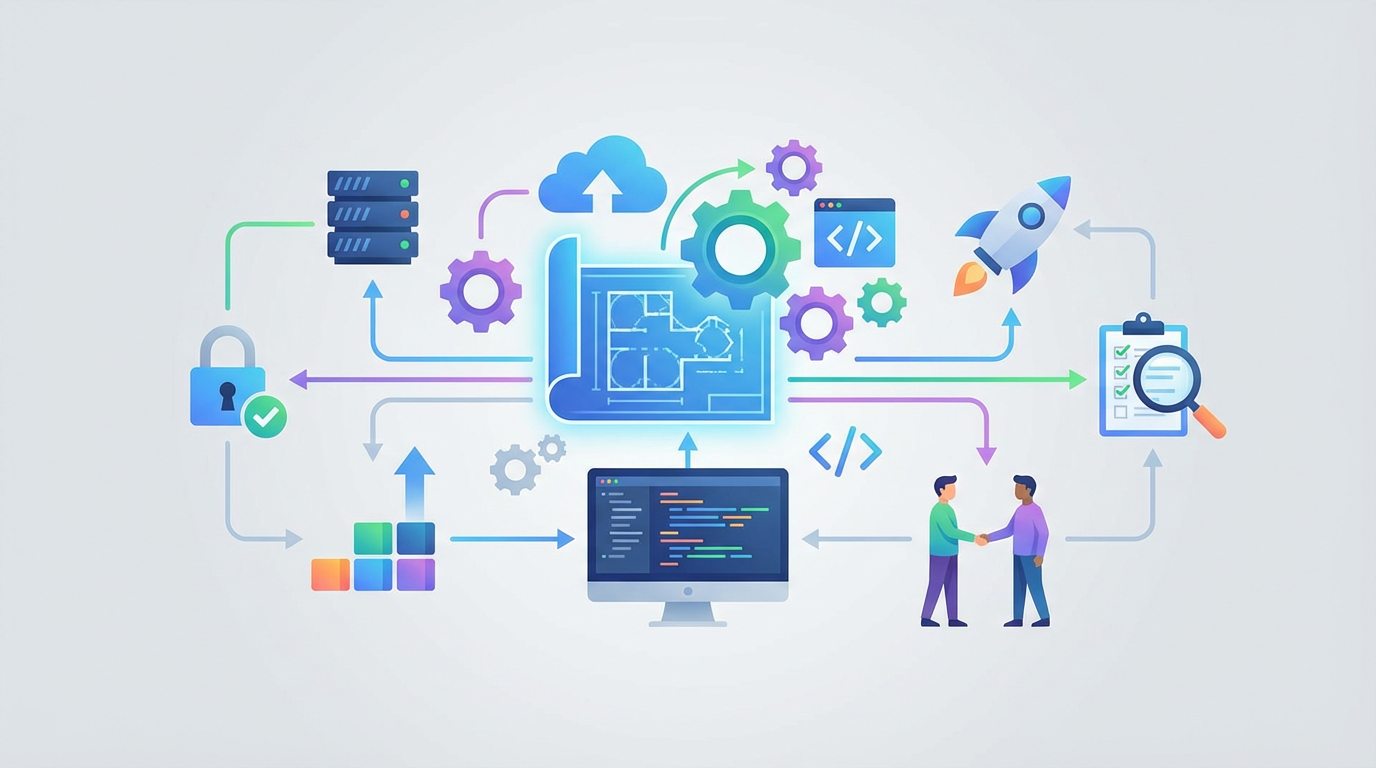
After watching dozens of teams struggle with their CI/CD implementations, I’ve noticed something. The ones that succeed don’t obsess over achieving 100% test coverage or building the most sophisticated deployment strategies. They focus relentlessly on feedback speed. A pipeline that tells you within three minutes that your change broke something will always outperform one that takes thirty minutes to deliver perfect information.

The Three Pipeline Principles That Actually Matter (And Why Most Teams Get Them Wrong)

The math is simple but brutal. If your feedback loop takes half an hour, developers switch away from their changes. They start working on something else. When the pipeline finally reports a failure, they need five to ten minutes just to remember what they were doing. That mental overhead compounds across every failed build, every flaky test, every deployment hiccup.

I’ve seen teams achieve remarkable stability with test suites that cover maybe 60% of their codebase, simply because those tests run in under two minutes. The developers actually wait for the results. They fix issues immediately. Compare that to teams with 95% coverage that takes twenty minutes to execute. Developers ignore those results, stack changes on top of broken commits, and spend their mornings untangling integration failures.

The sweet spot is around the three-minute mark for your core feedback loop. Anything faster is gold. Anything slower starts eroding developer behavior in ways that matter. Build your pipeline architecture around this constraint first, then optimize for everything else.

Illustration for The Three Pipeline Principles That Actually Matter (And Why Most Teams Get Them Wrong)

Deployment Should Be Boring

The most reliable deployments I’ve witnessed feel almost mundane. No war rooms. No special ceremonies. No holding your breath while watching metrics dashboards. Just a routine operation that happens dozens of times per day without anyone paying particular attention.

This boring quality doesn’t emerge by accident. It requires deliberate architectural choices that most teams skip in their rush to ship features. Blue-green deployments, feature flags, and proper health checks aren’t exciting technologies, but they transform deployment from a high-stakes event into routine maintenance.

Feature flags deserve special mention here because they solve the coordination problem that kills most deployment strategies. Instead of timing code releases with business requirements, you ship code continuously and activate features independently. Marketing wants to announce the new dashboard on Thursday? Great. The code deployed on Monday, Tuesday, and Wednesday. You flip the flag Thursday morning and grab coffee.

I’ve worked with teams that deploy forty times per day because they’ve made deployment boring. Their error rates are lower than teams that deploy weekly. Their mean time to recovery is measured in minutes, not hours. When deployment becomes routine, you get good at it. When it’s a special event, it stays dangerous.

Environment Consistency Matters More Than Environment Count

Most organizations approach environments backwards. They create elaborate promotion workflows through development, staging, pre-production, and production environments, each with slightly different configurations. Then they wonder why issues appear in production that never surfaced during testing.

The number of environments doesn’t improve quality. Configuration consistency does. I’ve seen two-environment setups outperform six-environment workflows because the two environments actually matched each other. Same operating system versions, same dependency versions, same resource constraints, same monitoring configuration.

Infrastructure as code isn’t optional for this approach. Your environments should emerge from identical scripts, with only minimal parameter differences for resource scaling. When a developer can spin up a production-equivalent environment on their laptop, you’ve achieved something valuable. When your staging environment requires a different deployment process than production, you’re testing the wrong thing.

The best pipeline design I’ve implemented used just three environments: development branches that developers could create on demand, a shared integration environment that mirrored production exactly, and production itself. Each environment used identical infrastructure code. The integration environment caught configuration issues that would have slipped through more traditional staging setups because it didn’t just approximate production, it replicated it.

Observability Must Be Built Into the Pipeline

Your CI/CD pipeline will fail. Not might fail, will fail. The question isn’t whether you’ll experience pipeline failures, but whether you’ll understand them quickly enough to maintain developer confidence. Teams that treat observability as an afterthought end up with pipelines that become black boxes when they break.

Good pipeline observability starts with structured logging that connects every stage of your build and deployment process. When a deployment fails, you should be able to trace the problem through build logs, test results, deployment scripts, and application health checks without jumping between different tools or searching through unstructured text files.

Metrics matter just as much as logs. Track build times, test suite duration, deployment frequency, and failure rates. But also track developer experience metrics like the time between commit and feedback, the number of commits per successful deployment, and the frequency of pipeline-related support requests. These numbers tell you whether your pipeline is helping or hindering your team’s productivity.

I always instrument pipelines to answer three questions immediately when something breaks: What failed? Why did it fail? How can we prevent this specific failure mode? The teams that can answer these questions in under five minutes maintain developer trust even through significant outages. The ones that can’t lose credibility with every unexplained failure.

These principles might seem obvious in isolation, but implementing them consistently requires discipline and organizational support. The payoff shows up in deployment confidence, developer productivity, and system reliability. If you’re designing a new pipeline or renovating an existing one, I’d love to hear about your specific challenges and constraints. The details always matter more than the theory.


Microservices Communication: The Protocols That Actually Matter in Production

Start With HTTP REST Because You Already Know It

When you’re moving from a monolith to microservices, your first instinct might be to research exotic communication protocols. Don’t. Start with what you know: HTTP REST. I’ve seen teams waste months evaluating gRPC, message queues, and GraphQL before they’ve even successfully split their first service. That’s backwards thinking.

Microservices Communication: The Protocols That Actually Matter in Production

HTTP REST works because your existing infrastructure already supports it. Your load balancers understand it. Your monitoring tools can parse it. Your team can debug it with curl. More importantly, when something breaks at 2 AM, you won’t be fumbling through protocol documentation while your site is down.

Build your first three services using plain HTTP REST with JSON. Focus on getting the service boundaries right, not the communication protocol. You’ll learn more about distributed systems in those first few weeks than you will from any protocol optimization. Once you have services talking to each other reliably, then you can optimize.

Illustration for Microservices Communication: The Protocols That Actually Matter in Production

When HTTP Isn’t Enough: The Message Queue Decision

You’ll know you need asynchronous communication when you find yourself writing retry logic for everything. If Service A needs to tell Service B something happened, but doesn’t need to wait for a response, that’s your signal. This is where message queues like RabbitMQ or cloud solutions like AWS SQS become valuable.

The pattern I recommend for beginners is straightforward: use REST for queries where you need immediate responses, and queues for commands where eventual consistency is acceptable. Order processing is a perfect example. When a user places an order, you can immediately return success to them while the actual fulfillment happens asynchronously through queues.

Start with a managed queue service if possible. Setting up RabbitMQ clusters correctly is a skill unto itself, and you’re trying to learn microservices communication, not become a message broker expert. AWS SQS or Google Cloud Pub/Sub will handle the infrastructure complexity while you focus on the communication patterns.

One thing I learned the hard way: always include correlation IDs in your messages. When you’re debugging why an order didn’t process, being able to trace a single request across multiple services and queue hops will save your sanity. Trust me on this one.

gRPC: When Performance Actually Matters

Don’t reach for gRPC because it sounds modern. Reach for it when HTTP REST becomes a measurable bottleneck. I typically see this happen when services are making hundreds of calls per second between each other, or when you’re dealing with large payloads that benefit from Protocol Buffer serialization.

The sweet spot for gRPC is internal service-to-service communication where you control both ends. The type safety from Protocol Buffers catches errors at compile time that would otherwise surface as runtime bugs. The performance improvement is real, but it comes with complexity costs that beginners underestimate.

If you decide to try gRPC, start with one pair of services that communicate frequently. Convert their REST calls to gRPC and measure the difference. Don’t try to convert everything at once. The learning curve for debugging gRPC issues is steeper than HTTP, especially around networking and load balancing.

Event-Driven Architecture: The Advanced Pattern

Event-driven communication is powerful but introduces complexity that can overwhelm teams new to microservices. The basic idea is that services publish events when something significant happens, and other services subscribe to those events. This creates loose coupling between services, which is exactly what you want in a mature microservices architecture.

The challenge is that event-driven systems are harder to reason about. With REST calls, you can follow the request path directly. With events, you need to understand which services are listening to which events, and the order of operations becomes less predictable. This makes debugging more difficult.

I recommend introducing events gradually. Start with domain events that represent business milestones: “OrderPlaced”, “PaymentProcessed”, “ShipmentCreated”. These events often have clear business value and are easier to understand than technical events. Use them to decouple services that don’t need tight consistency.

Apache Kafka is the gold standard for event streaming, but it’s complex to operate. If you’re on AWS, consider Kinesis or EventBridge. For smaller systems, even a simple queue can publish events that multiple services consume.

The Protocol Decision Framework

Here’s the decision framework I use when choosing communication protocols. For synchronous communication where you need a response, start with HTTP REST. Consider gRPC only when performance measurements show HTTP is insufficient. For asynchronous communication, start with simple message queues. Move to event streaming when you need multiple consumers for the same message.

The most important principle is consistency within your system. Don’t use different protocols for similar use cases just because you can. If you’re using HTTP REST for user queries, use HTTP REST for admin queries too. Consistency reduces cognitive load and makes your system easier to maintain.

Changing communication protocols later is entirely possible. I’ve seen systems evolve from REST to gRPC to events as they matured. The key is making these changes deliberately based on measured needs, not theoretical benefits.

Communication protocols are just tools. The real challenge in microservices is designing good service boundaries and handling partial failures gracefully. Master those fundamentals first, and the protocol choices become much clearer. What communication challenges are you facing in your microservices journey? The specific problems you’re trying to solve will guide you toward the right solutions.

Database Optimization Theater: Why Your Performance Fixes Aren’t Working

The Index Mythology That Won’t Die

Every week, some well-meaning developer discovers database performance optimization and promptly starts adding indexes to everything that moves. I’ve seen production tables with fifteen indexes on twelve columns, each one added by someone who read that indexes make queries faster. The performance didn’t improve. Sometimes it got worse.

Here’s what actually happens when you throw indexes at a wall. Each additional index needs maintenance during writes. Your INSERT statements slow down because the database engine has to update multiple index structures. Your disk usage explodes. Query planner gets confused by too many options and starts making bad choices. I’ve debugged systems where removing indexes improved performance more than adding them ever did.

The real work happens in understanding query execution plans. Not the pretty diagrams that database tools generate, but the actual cost estimates and row counts. When PostgreSQL tells you it’s doing a sequential scan on a million-row table, that’s not always wrong. Sometimes the selectivity is so poor that an index scan would need more disk seeks than just reading the whole table linearly.

Connection Pool Cargo Culting

Connection pooling has become the database equivalent of “have you tried turning it off and on again.” Teams implement HikariCP or pgbouncer without understanding what problem they’re actually solving. I’ve seen applications with connection pools configured for 200 connections hitting databases that perform best with 20.

Database servers aren’t web servers. They don’t scale horizontally by adding more connections. PostgreSQL, for instance, creates a separate process for each connection. More processes mean more context switching, more memory overhead, and more lock contention. Oracle handles this differently with its shared server architecture, but the principle remains: connections are expensive resources.

The sweet spot for connection count depends on your storage subsystem, not your application load. If you’re running on spinning disks, you probably want fewer connections than you think. SSDs change the equation, but not in the way most people assume. I’ve seen properly tuned single-connection workloads beat multi-connection chaos by orders of magnitude.

The Query Optimization Arms Race

Query optimization advice tends to focus on SQL gymnastics while ignoring fundamental data modeling problems. You can’t optimize your way out of a poorly normalized schema or wrong data types. I’ve watched teams spend weeks crafting elaborate CTE structures when the real issue was storing JSON in text fields and parsing it at query time.

Subquery rewriting gets treated like some kind of dark art. Move the subquery to a JOIN. Convert the EXISTS to an IN. Use window functions instead of correlated subqueries. These transformations work sometimes, but modern query optimizers already do most of these rewrites automatically. PostgreSQL’s optimizer has been doing subquery flattening since version 8.4.

The performance gains come from understanding data distribution and cardinality estimation. When your query planner estimates 1,000 rows but gets 100,000, no amount of SQL rewriting will fix the resulting performance disaster. Accurate statistics matter more than clever syntax. Run ANALYZE. Update your histogram bounds. Understand how your optimizer makes decisions based on the statistics it has available.

Hardware Theater and Configuration Mythology

Database performance discussions always turn into hardware specifications and configuration parameter tuning. More RAM, faster SSDs, increase shared_buffers, tune work_mem. These changes might help, but they’re treating symptoms rather than causes.

I’ve seen databases perform poorly on high-end hardware because the application was making fundamentally inefficient data access patterns. Fetching records one at a time in a loop instead of using batch operations. Running thousands of identical queries with different parameters instead of using prepared statements properly. No amount of RAM will fix an N+1 query problem.

Configuration tuning follows the same pattern. Teams obsess over buffer pool sizes and checkpoint intervals while ignoring obvious inefficiencies in their data access patterns. PostgreSQL’s default configuration works reasonably well for many workloads. MySQL’s defaults are more conservative but rarely the bottleneck. The real performance problems usually live in the application layer, not the database configuration.

Measuring What Actually Matters

Database performance monitoring tools generate impressive dashboards full of metrics that don’t relate to user experience. Query throughput, connection counts, buffer hit ratios. These numbers look scientific, but they often miss the actual performance problems.

Response time distribution tells you more than average query duration ever will. Your 95th percentile latency might be fine while your 99th percentile is terrible. A handful of bad queries can make aggregate metrics look healthy while users experience timeouts and errors. I’ve debugged production systems where average query time was 50 milliseconds, but 1% of queries took over 30 seconds.

Lock contention shows up in wait event analysis, not in CPU graphs. Hot blocks, buffer busy waits, and lock acquisition patterns reveal bottlenecks that don’t appear in traditional system monitoring. PostgreSQL’s pg_stat_statements extension and MySQL’s Performance Schema provide this level of detail, but most teams never look beyond basic resource utilization.

Real performance optimization takes discipline and measurement. It means profiling your actual workload, understanding your data access patterns, and making targeted changes based on evidence rather than folklore. The database optimization world is full of silver bullets that turned out to be blanks.

What’s your experience been with database performance optimization? Have you run into other examples of conventional wisdom that didn’t hold up under scrutiny? I’m particularly interested in hearing about cases where counterintuitive approaches actually worked in production environments.

Building Your First Mentorship Framework as a Senior Engineer

Why Most Senior Engineers Struggle with Mentorship

You know the systems inside and out. You can debug a race condition at 2 AM while half asleep. But when that new junior developer asks how you approach problem-solving, you suddenly sound like you’re reading from a manual. This disconnect happens because we assume teaching follows the same patterns as building software. It doesn’t.

Building Your First Mentorship Framework as a Senior Engineer

Mentorship requires a completely different mental model. When you’re deep in complex systems work, your brain operates in layers of abstraction that took years to develop. A junior developer hasn’t built those layers yet. They’re seeing the same codebase through completely different cognitive structures. Understanding this gap is where effective mentorship begins.

Most senior engineers either over-explain everything or assume too much context. I’ve watched brilliant architects lose junior developers in the first ten minutes by diving straight into system design patterns. The sweet spot is starting with shared understanding, then building complexity one step at a time. Think of it like designing an API with clear contracts and predictable behavior.

Illustration for Building Your First Mentorship Framework as a Senior Engineer

The Three-Layer Mentorship Model

After years of trial and error, I’ve settled on what I call the three-layer approach. The foundation layer focuses on immediate, tactical skills. This means pairing on actual work, showing debugging techniques, and explaining code review feedback in real-time. Don’t just point out issues. Walk through your thought process as you identify them.

The middle layer addresses broader technical concepts. This includes system design principles, architectural patterns, and technology trade-offs. But here’s the part that matters: always tie these concepts back to code they’re actually working with. Abstract discussions about microservices architecture mean nothing until they’re debugging a service mesh timeout in production.

The top layer covers career and organizational navigation. This includes understanding team dynamics, communicating with stakeholders, and making technical decisions when you don’t have all the information. These skills often determine long-term success more than pure technical ability, yet they’re rarely taught explicitly.

Start with Code Reviews That Actually Teach

Code reviews are your highest-leverage mentorship opportunity, but most seniors waste them. Instead of just flagging issues, use reviews to show your thinking process. When you spot a potential performance problem, don’t just say “this will be slow.” Explain how you recognized the pattern, what specific conditions would trigger the issue, and how you’d approach optimization.

Create a review template that includes context questions. Ask the developer to explain their approach before diving into line-by-line feedback. This helps you understand their mental model and adjust your guidance accordingly. A junior developer who’s confused about database indexing needs different feedback than one who understands the concept but missed an edge case.

Make your reviews asynchronous but available for follow-up. Leave detailed comments that stand alone, but offer quick calls to discuss complex topics. Some architectural decisions can’t be fully explained in text. A five-minute screen share often clarifies what would take twenty comment exchanges.

Track patterns in your feedback over time. If you’re repeatedly explaining the same concepts, that signals a gap in foundational knowledge. Address these systematically rather than reactively. Create or find resources that explain these concepts clearly, then reference them in future reviews.

Build Debugging Skills Through Structured Problem-Solving

Debugging is where experience shows most clearly. It’s also where junior developers often feel most lost. Instead of solving problems for them, narrate your debugging process step by step. Start with hypothesis formation. What do you suspect based on the symptoms? Why? What would you expect to see if that hypothesis is correct?

Teach them to gather evidence systematically. Show how you read logs, trace through execution paths, and isolate variables. This sounds obvious, but junior developers often jump between different debugging approaches without a clear methodology. Give them a framework they can follow consistently.

Create debugging exercises using real issues from your codebase. Take a resolved bug, reproduce the conditions, and walk through the investigation together. This is more valuable than theoretical examples because it shows how debugging applies to your specific technology stack and system architecture.

Most importantly, show them how to know when to stop. Junior developers often over-investigate or get stuck in rabbit holes. Teach them to recognize when they have enough information to implement a fix, and when they should escalate for help. Time-boxing investigation phases prevents endless debugging cycles.

Create Safe Spaces for Technical Growth

The best technical learning happens when people feel safe to experiment and fail. This means creating environments where junior developers can break things without consequences. Set up development environments that mirror production but can be reset quickly. Give them ownership over non-critical features where mistakes won’t impact users.

Establish regular one-on-ones focused on technical growth rather than project status. Ask about what they’re learning, what concepts are unclear, and what interests them most. These conversations often reveal knowledge gaps that don’t surface in daily work. They also help you understand their career goals and adjust mentorship accordingly.

Introduce complexity gradually through increasingly challenging assignments. Start with well-defined features, then move to bug fixes, then to investigative work, and finally to open-ended problems. Each step builds confidence while expanding their technical toolkit. The sweet spot is ensuring they’re stretched but not overwhelmed.

Document your team’s technical standards and decision-making processes. This gives junior developers a reference for understanding not just what you do, but why you do it. Include examples of good and bad implementations, with explanations of the trade-offs involved. This helps them internalize the thinking patterns that drive architectural decisions.

Effective mentorship changes both the mentor and the mentee. Teaching forces you to articulate knowledge you’ve internalized, often revealing gaps in your own understanding. If you’re interested in developing these skills further or want to share your own mentorship experiences, I’d love to continue the conversation. The best mentorship approaches evolve through shared learning and honest reflection on what actually works in practice.

API Versioning in 2025: Beyond REST and the Rise of Contract-First Design

The Versioning Reality Check: What Actually Works

After spending fifteen years building APIs that power everything from mobile banking to supply chain orchestration, I’ve watched versioning strategies evolve from afterthoughts to something people actually think about upfront. The harsh reality? Most teams still treat versioning as a deployment problem rather than a design constraint. They ship v1, realize they need breaking changes, slap on v2 headers, and wonder why their mobile apps crash in production.

API Versioning in 2025: Beyond REST and the Rise of Contract-First Design

The signal is clear from successful API programs at companies like Stripe, GitHub, and Shopify: versioning isn’t a technical decision. It’s a product strategy that determines whether your API becomes platform infrastructure or technical debt. The difference is treating your API contract as immutable law, not a rough draft.

Here’s what works in practice. URL versioning is still the most predictable approach for external APIs, despite the REST purists’ objections. When Slack moved from webhook v1 to v2, they used clear URL paths like `/api/v2/webhooks` because developers could grep their codebases and find every integration point. Header-based versioning sounds elegant until you’re debugging a production incident at 3 AM and can’t tell which version a request used from your access logs.

Contract-First Architecture: The New Baseline

The industry shift toward contract-first API design is more than tooling evolution. It’s a fundamental rethinking of how we build distributed systems. OpenAPI specifications, once nice-to-have documentation, now drive code generation, testing, and deployment pipelines. Teams using tools like Spectral for linting and Prism for mocking report 40% fewer integration bugs in production.

What makes this approach work is the forcing function it creates. When your API contract must be defined before a single line of implementation code gets written, breaking changes become impossible to ignore. You start designing for extension rather than modification. I’ve seen teams reduce their major version releases from quarterly to annual cycles simply by investing two weeks upfront in contract design workshops.

The tooling has gotten really good. AsyncAPI for event-driven architectures, GraphQL schemas for query flexibility, and Protocol Buffers for performance-critical services all enforce contract-first thinking. More importantly, they generate artifacts that make versioning explicit rather than implicit. Your CI pipeline either passes schema compatibility checks or your deployment fails. No exceptions.

Event-Driven Versioning: The Emerging Pattern

Traditional request-response versioning breaks down in event-driven architectures. When you’re publishing events to message queues or streaming platforms, you can’t negotiate API versions like HTTP allows. The solution emerging from companies building at scale involves embedding schema evolution directly into event payloads using formats like Apache Avro or Protocol Buffers.

The pattern works by treating each event type as an independent contract with its own evolution rules. Consumer applications declare their minimum required schema version, and producers ensure backward compatibility within defined windows. Confluent’s Schema Registry popularized this approach, but I’m seeing similar patterns in AWS EventBridge and Azure Service Bus implementations.

What excites me about this trend is its natural alignment with microservices reality. Services evolve independently, deploy independently, and now version independently. Here’s what I think happens next: event-driven versioning will influence how we design synchronous APIs. I expect to see more APIs adopting payload-level versioning even for REST endpoints by 2026.

The AI-Driven API Lifecycle

Large language models are reshaping API development workflows in ways most teams haven’t recognized yet. GitHub Copilot and similar tools excel at generating boilerplate API code, but their real impact is in consistency enforcement. When an AI assistant helps implement your API endpoints, it naturally follows the patterns established in your existing codebase, reducing accidental breaking changes.

More intriguingly, AI tools are becoming sophisticated enough to suggest versioning strategies based on code analysis. Tools like OpenAI’s Codex can analyze your API surface area and flag potential breaking changes before they reach production. This isn’t speculation anymore. I’ve tested prototypes that successfully identified 85% of breaking changes in a complex GraphQL schema by analyzing resolver implementations.

The next step involves automated compatibility testing powered by LLMs. Instead of maintaining extensive test suites for every API version, AI systems could generate compatibility tests dynamically based on contract changes. Early experiments using GPT-4 to generate integration tests from OpenAPI diffs show promising results, though production readiness is still 12-18 months away.

Platform Engineering Meets API Governance

The platform engineering movement directly impacts API versioning strategies. Internal developer platforms increasingly provide API gateways, schema registries, and versioning policies as managed services. Teams no longer choose their versioning strategy in isolation. Platform teams enforce organization-wide standards through infrastructure constraints.

This centralization enables sophisticated versioning policies that were previously impossible to implement consistently. Automatic deprecation timelines, consumer impact analysis, and coordinated migration tooling become platform capabilities rather than team responsibilities. Companies like Netflix and Uber report significant reductions in API sprawl after implementing platform-enforced versioning standards.

The emerging pattern involves treating API versions as infrastructure resources with defined lifecycles. Platform teams provide self-service tooling for version creation, promotion, and retirement, while maintaining centralized visibility into version usage across the organization. This approach scales organizational knowledge rather than requiring every team to become API design experts.

The versioning strategies that survive the next five years will balance technical elegance with operational reality. Contract-first design provides the foundation, but success depends on tooling, governance, and team practices that make good versioning decisions the easy decisions. I’m curious about your experiences with API versioning in complex systems, particularly around event-driven architectures and platform engineering approaches.

Infrastructure as Code: The Hard-Won Lessons That Actually Matter

Start Small, Think Big, but Actually Start Small

Every infrastructure-as-code journey begins with grand ambitions. You’ll automate everything. Every server, every load balancer, every DNS record will be declared in pristine YAML or HCL. This is a mistake I’ve watched teams make repeatedly, and one I made myself early on.

Infrastructure as Code: The Hard-Won Lessons That Actually Matter

The reality is that IaC adoption works best when you pick one well-understood piece of infrastructure and nail it completely. Choose something with clear boundaries, maybe your application load balancers or your RDS instances. Get the state management right. Figure out your module structure. Work through the inevitable credential and permission headaches. Then expand to the next component.

I’ve seen more IaC initiatives fail from trying to automate everything at once than from any technical limitation. The teams that succeed are the ones that ship working infrastructure code for one thing, then methodically expand their scope. The tooling can handle enterprise complexity, but your team needs time to build the operational muscle memory. Plus, you’ll discover quirks and gotchas that are much easier to solve when you’re focused on one piece at a time.

Illustration for Infrastructure as Code: The Hard-Won Lessons That Actually Matter

State Files Are Your Single Point of Failure

Let’s talk about the elephant in the room: state management. Whether you’re using Terraform, Pulumi, or something else, your state file is the source of truth about what actually exists in your infrastructure. Lose it, corrupt it, or have two people modify it at the same time, and you’re in for a world of pain.

Remote state backends aren’t optional, they’re mandatory from day one. I don’t care if you’re just experimenting. Set up S3 with DynamoDB locking, or use Terraform Cloud, or whatever your platform’s equivalent is. The local state file on your laptop is a ticking time bomb. I’ve wasted too many hours reconstructing infrastructure because someone thought they’d “just test something quickly” with local state.

State file versioning and backup strategies matter more than most people realize. Enable versioning on your remote backend. Set up automated backups. Have a runbook for state file recovery. You’ll thank yourself when something goes wrong, and trust me, something will go wrong.

Modules and Composition: Where Good Intentions Go to Die

The module pattern is tempting. Create reusable components, promote consistency, reduce duplication. In theory, it’s beautiful. In practice, it’s where most IaC codebases turn into unmaintainable messes.

The problem isn’t modules themselves, it’s premature abstraction. Teams create modules before they understand the problem space. They build generic “compute modules” that take forty-seven input variables and try to handle every possible use case. Six months later, you’re passing null values to half the variables and wondering why your simple web server declaration looks like a spacecraft launch checklist.

My rule: don’t create a module until you’ve written the same configuration three times in three different contexts. When you do create modules, build specific, purpose-built ones instead of generic ones. A “web-app-infrastructure” module that handles exactly the load balancer, security groups, and auto-scaling configuration for your web applications is infinitely more useful than a “compute” module that can theoretically provision anything.

Version your modules aggressively. Use semantic versioning. Pin to specific versions in your configurations. Module updates should be conscious decisions, not surprises that break your production deployment on Tuesday afternoon.

The Testing Problem Nobody Wants to Talk About

Testing infrastructure code is hard. Really hard. Unit testing a Terraform module feels like testing a JSON file, you’re mostly validating syntax and structure. The interesting failures happen when your code interacts with the actual cloud provider APIs, deals with eventual consistency, or runs into regional availability constraints.

Integration testing is where the real value lives, but it’s expensive and slow. Spinning up actual infrastructure to test your code means dealing with resource quotas, cleanup procedures, and test isolation. It also means your test suite might cost more to run than your actual infrastructure. I’ve seen teams spend hundreds of dollars a month just running tests.

The pragmatic approach I’ve settled on: extensive validation and planning steps, combined with careful staging environments and feature flags. Use your IaC tooling’s built-in validation. Write tests that verify your modules generate sensible plans. Deploy to a staging environment that mirrors production as closely as possible. Use feature flags or blue-green deployments to reduce the blast radius of changes.

Don’t let perfect be the enemy of good here. Some testing is infinitely better than no testing, even if you can’t achieve the same coverage you’d get with application code.

Security and Secrets: The Details That Matter

Secrets management in IaC is where security hygiene meets operational reality. Hardcoding secrets in your configuration files is obviously wrong, but the right approach isn’t always obvious. Environment variables work for simple cases but become unwieldy at scale. External secret stores are the right answer, but add operational complexity.

The pattern that’s worked best in my experience: use your IaC tooling to create the infrastructure for secrets (the KMS keys, the secret stores, the IAM roles), but don’t use it to manage the secret values themselves. Let your applications pull secrets at runtime from dedicated secret management services. This separates infrastructure provisioning from secret rotation and reduces the surface area for accidental exposure.

Pay attention to your IaC tooling’s plan and apply outputs. Sensitive values can leak into logs, especially in CI/CD systems. Use your tooling’s sensitivity markers. Review your pipeline logs. Set up log retention and access controls.

These aren’t just best practices, they’re the lessons learned from real incidents. I’ve seen teams leak database passwords into build logs, and I’ve seen state files with hardcoded API keys checked into public repositories. The devil is in the details when it comes to IaC security.

What’s your experience been with infrastructure as code? I’m particularly interested in hearing about the unexpected challenges you’ve encountered, especially around team adoption and operational procedures. The technical problems are usually solvable, it’s the human and process problems that tend to be more interesting.

Container Orchestration Reality Check: Beyond the Hype of Modern Platform Engineering

The Kubernetes Monopoly Problem

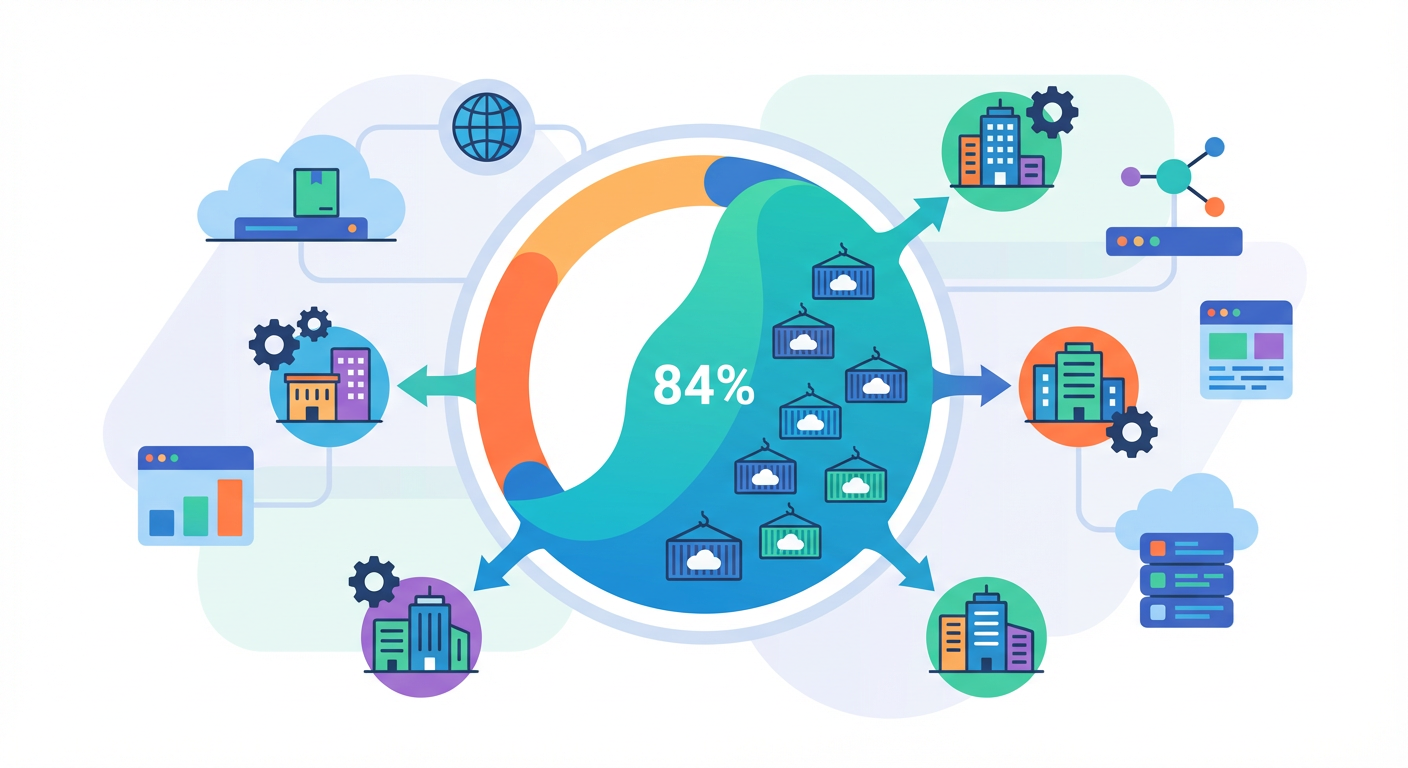
Let’s talk about the elephant in the room. When 84 percent of organizations running containers have standardized on Kubernetes, we’re not looking at healthy competition anymore. We’re looking at market consolidation that honestly makes me uncomfortable as a technologist. This near-universal adoption doesn’t automatically mean Kubernetes is the best solution for every use case.

Container Orchestration Reality Check: Beyond the Hype of Modern Platform Engineering

The complexity overhead of Kubernetes is massive, no matter what the evangelists say. Organizations are trading one set of operational headaches for another, often more complicated set. The Kubernetes documentation runs thousands of pages for good reason. This isn’t simplification. It’s abstraction with a brutal learning curve.

The momentum feels unstoppable. Network effects are real, and the ecosystem naturally gravitates toward the dominant player. But here’s the thing: dominant doesn’t mean optimal. Widespread adoption doesn’t magically eliminate the fundamental architectural trade-offs that many organizations are just starting to understand.

Illustration for Container Orchestration Reality Check: Beyond the Hype of Modern Platform Engineering

Docker’s Licensing Gambit and Developer Inertia

The Docker Desktop licensing controversy was supposed to shake things up. But developer usage patterns? Remarkably stable. This tells us something important about developer tooling: switching costs often matter more than licensing costs, especially when corporate budgets absorb those fees instead of individual developers.

The licensing controversy made plenty of noise. Alternatives like Podman and containerd got attention. But actual migration numbers tell a different story. Most developers stick with familiar tools until someone forces them to change. Organizations found it easier to pay Docker than retrain their teams.

This pattern reveals a bigger issue in containerization. Tool selection increasingly depends on familiarity and ecosystem lock-in rather than technical merit. When switching costs are high, market leaders can extract more value without delivering proportional improvements. It’s frustrating, but it’s reality.

Platform Engineering: Abstraction or Complexity Theater?

Platform engineering teams are either a necessary evolution or an admission of failure. Depends on how you look at it. These teams are supposed to abstract infrastructure complexity away from application developers. The real question is whether they’re solving the right problem or just moving complexity around.

Platform engineering promises to democratize infrastructure access while maintaining operational standards. In practice, it often creates new bottlenecks and communication overhead between application teams and the underlying infrastructure. Those abstraction layers can become black boxes that hide system behavior instead of clarifying it.

The growth of these specialized teams makes me wonder about organizational efficiency. Are we creating more specialized roles because our tools are too complex? Or are we finally organizing around sustainable operational practices? The answer varies between organizations, but the trend suggests infrastructure complexity has outpaced most teams’ ability to manage it directly.

eBPF and WebAssembly: Signal Through the Noise

Extended Berkeley Packet Filter technology actually deserves attention beyond the typical hype cycle. eBPF’s ability to enable deep observability without code instrumentation is a genuine technical advancement. Operating at the kernel level, it provides insights that traditional monitoring approaches simply can’t match.

But eBPF adoption requires kernel-level expertise that most development teams don’t have. The promise of seamless observability comes with the reality of specialized knowledge requirements. Organizations need to invest in education or hire specialists to get real value from eBPF.

WebAssembly’s expansion beyond browsers into server-side workloads is interesting. The technology offers near-native performance with sandboxed execution, addressing legitimate concerns about security and resource isolation. But WebAssembly also introduces new complexity in toolchain management and debugging workflows.

Both technologies represent real innovations rather than marketing-driven trends. However, adopting them requires careful consideration of organizational capability and genuine need rather than FOMO about the latest developments.

GitOps: From Practice to Orthodoxy

GitOps has achieved something rare: it became standard practice without significant technical controversy. Organizations with mature DevOps cultures have largely adopted Git-centric deployment workflows, and the results generally justify the investment.

The appeal is straightforward. Treating infrastructure and application configuration as code provides versioning, rollback capabilities, and audit trails that traditional deployment methods can’t match. GitOps workflows align naturally with existing developer practices, reducing the mental overhead of deployment management.

But the uniformity of GitOps adoption across mature organizations suggests limited experimentation with alternative approaches. While GitOps solves real problems effectively, the lack of diversity in deployment methodologies might indicate premature convergence on a single pattern. The CNCF landscape shows numerous GitOps implementations, but they largely follow the same fundamental patterns.

GitOps standardization reflects broader maturation in the containerization space, but it also raises questions about whether the industry has adequately explored alternative deployment paradigms. Sometimes consensus emerges from thorough evaluation. Sometimes it emerges from path dependence and risk aversion.

These trends in containerization and platform engineering reflect both genuine technological progress and the natural tendency of complex systems to accumulate layers of abstraction. The challenge for technical decision-makers is distinguishing between solutions that address fundamental problems and those that simply reorganize existing complexity into new configurations. What’s your organization’s experience with these patterns?

Core Web Vitals in 2026: The Performance Metrics That Make or Break Your Site

Why Core Web Vitals Still Matter More Than Ever

Google’s integration of Core Web Vitals into its ranking algorithm in 2021 changed everything about how search engines think about user experience. Five years later, these performance metrics aren’t just nice-to-have optimizations anymore. They’re requirements if you want to compete.

Core Web Vitals in 2026: The Performance Metrics That Make or Break Your Site

The stakes are higher now. What started as Google politely suggesting we optimize performance has become hard thresholds. Sites that miss the mark get hit with real ranking penalties. Sites that nail it see actual gains in organic traffic.

And honestly? Users expect fast everything now, regardless of device or connection speed. But web apps keep getting more complex, creating this constant tension between cool features and quick loading times.

The Current Metric Landscape and Recent Changes

The three Core Web Vitals have gotten much stricter since they launched. Largest Contentful Paint (LCP) is still the main loading performance metric, but the bar is way higher. Today you need to hit under 2.5 seconds to stay competitive, and the best sites are loading well under 2 seconds.

The biggest change happened in March 2024 when Google replaced First Input Delay with Interaction to Next Paint. This switch made sense because measuring just the delay before processing starts only tells half the story. INP captures what users actually experience when they click or tap something, from start to finish.

Cumulative Layout Shift is still the metric that keeps your page from jumping around, but it’s gotten more important as sites rely more on dynamic content. Those annoying layout shifts hit your rankings harder now, especially on mobile where every pixel counts.

Edge Computing’s Performance Revolution

Edge computing platforms like Cloudflare Workers and Vercel’s Edge Functions have completely changed how we think about performance optimization. Now you can run code milliseconds away from your users instead of making them wait for round trips to distant servers.

This solves one of web performance’s biggest headaches: latency across continents. Old-school CDNs could only cache static files, but modern edge platforms actually execute code closer to users. The speed difference is dramatic.

It goes beyond just speed, though. Edge computing lets you do sophisticated stuff like personalized content delivery and real-time A/B testing without the performance hit you’d normally get from centralized processing. Smart routing automatically sends requests to the best edge location based on current load and distance.

The downside? Debugging edge functions is a pain. Performance issues can pop up from inefficient edge code or weird data fetching patterns that weren’t even considerations with traditional server setups.

Next-Generation Image Formats and Asset Optimization

Image format evolution has been huge for web performance. AVIF is the clear winner for photos, cutting file sizes up to 50 percent compared to JPEG while looking better. WebP is still the solid fallback when you need broader browser support.

But format choice is just the beginning. Smart optimization now uses Container Queries and advanced srcset configurations to deliver exactly the right image size for each viewing situation. No more mobile devices downloading massive desktop images.

Lazy loading went from requiring JavaScript libraries to being built into browsers, though the implementation details still separate decent performance from excellent performance. Intersection Observer optimizations and loading priority hints give you precise control over when resources load.

AI-powered image compression tools have gotten really good at automatically optimizing images without manual tweaking. They analyze each image to apply the best compression settings, though you still need to double-check that your important brand imagery doesn’t get mangled.

JavaScript: The Persistent Performance Bottleneck

Here’s the frustrating truth: after years of better tools and optimization frameworks, bloated JavaScript bundles are still the main reason sites fail Core Web Vitals. Modern apps regularly ship hundreds of kilobytes of JavaScript that has to run before users can actually do anything.

The problem builds up throughout development. Frameworks push component-heavy architectures that create massive dependency trees. Build tools try to help but often can’t eliminate unused code effectively. You end up shipping tons of dead code to production.

Tree shaking and code splitting help, but they require deep understanding of how your modules connect to each other. Good splitting strategies consider loading priorities and user behavior patterns, not just bundle size. You need to analyze which JavaScript absolutely must run immediately versus what can wait until after the page renders.

Server-side rendering and static site generation move some execution from client to build time, but hydration costs often cancel out the gains. This is especially true for highly interactive apps. Progressive hydration and island architectures offer smarter approaches that balance interactivity with performance.

Tools like web.dev performance guidance and PageSpeed Insights keep getting better at helping developers spot and fix JavaScript performance issues. But you still need to plan your architecture carefully from day one.

The 2026 performance landscape rewards methodical thinking and constant measurement. As Core Web Vitals become more sophisticated benchmarking tools, the sites that succeed treat performance as a core design constraint, not something to fix later. What specific performance challenges are you dealing with in your current projects?

The Silent Crisis Powering Your Digital Life

The Invisible Foundation

Your smartphone works. Your bank processes transactions. Netflix streams without buffering. Behind this smooth digital experience lies an uncomfortable truth: pretty much everything depends on software maintained by volunteers in their spare time.

More than 96 percent of the world’s top one million web servers run on Linux. This isn’t some niche statistic. These machines process your search queries, handle your financial transactions, and store your photos. The operating system powering this infrastructure was built by thousands of contributors, many getting nothing beyond recognition from peers.

Apache web servers, Nginx load balancers, and PostgreSQL databases generate billions in enterprise revenue for companies like Amazon, Google, and Microsoft. Yet the core maintainers of these projects often struggle to fund basic development needs. This isn’t sustainable engineering. It’s digital feudalism.

The Burnout Epidemic

Open source maintainer burnout has hit crisis levels. Key contributors walk away from projects that support entire industries, leaving security vulnerabilities unpatched and features undeveloped. The Open Source Initiative documents case after case of essential projects abandoned when maintainers burn out from unpaid labor.

Corporate response has been reactive rather than proactive. GitHub’s sponsors program has distributed over $30 million to maintainers, but this is a fraction of the value these projects create. Companies that build billion-dollar businesses on open source foundations often contribute nothing back to the communities that make their success possible.

The math doesn’t work. A single developer maintaining a library used by millions of applications cannot scale indefinitely. When they inevitably burn out, the entire ecosystem suffers. Security patches get delayed. New features stagnate. Dependencies become liability time bombs.

Regulatory Pressure and New Liabilities

The European Union’s Cyber Resilience Act introduces unprecedented liability requirements for software providers, including open source projects. Maintainers who previously operated under informal community norms now face potential legal consequences for security vulnerabilities.

This regulatory shift forces a reckoning. Projects that handle sensitive data or support infrastructure can no longer operate as hobby endeavors. They need professional development practices, security audits, and legal compliance frameworks. These requirements cost money that most projects don’t have.

The legislation aims to improve software security, but its practical effect may eliminate many smaller open source projects. Maintainers cannot absorb legal liability for software they distribute freely. Expect consolidation as smaller projects shut down rather than navigate complex regulatory requirements.

Evolution in Critical Systems

The transition from C to Rust in safety-critical systems signals a broader transformation in open source infrastructure. Linux kernel developers increasingly adopt Rust for new components, while Amazon Web Services replaces C implementations with memory-safe alternatives.

This shift reflects growing awareness that traditional approaches to systems programming introduce unacceptable risks. Buffer overflows and memory corruption vulnerabilities plague C codebases, creating attack surfaces in infrastructure. Rust’s compile-time memory safety guarantees eliminate entire categories of bugs.

However, this transition creates new dependencies and complexity. Rust toolchains require different expertise than C development. Projects must retrain contributors or recruit new talent. The GitHub Open Source community shows growing Rust adoption, but migration costs remain significant for established projects.

Language evolution also fragments the contributor base. Developers skilled in C may not transition to Rust, reducing the pool of qualified maintainers for projects. This expertise gap compounds existing sustainability challenges.

The Path Forward

Open source sustainability requires systemic change, not charitable gestures. Companies that profit from open source infrastructure must fund development proportional to their usage. This means moving beyond GitHub stars and occasional donations to structured support for maintainer salaries, security audits, and project governance.

Professional support structures need to emerge around projects. The current model of volunteer maintainers managing enterprise software is fundamentally broken. Organizations like foundations and consortiums can provide governance frameworks, but they require sustained funding from beneficiary companies.

Regulatory compliance will force professionalization whether we plan for it or not. Projects can either evolve proactively with proper funding and governance, or they can disappear when maintainers cannot handle new liability requirements. The choice belongs to the companies that depend on this infrastructure.

The next decade will determine whether open source remains a sustainable model for infrastructure. The warning signs are clear. The question is whether the industry will respond before the foundation crumbles. What’s your organization doing to support the projects it depends on?

The Cloud Cost Revolution: How FinOps Maturity Will Transform Enterprise Spending in 2025

The $100 Billion Cloud Waste Problem

Enterprise cloud spending will hit record heights in 2025, but nearly one-third of that investment will vanish into digital thin air. Industry analysts project that cloud waste will eat up roughly 32 percent of total cloud spending next year—that’s over $100 billion in wasted resources across global enterprises.

This isn’t just some abstract statistic. It shows a basic problem with how organizations think about cloud economics. The era of “lift and shift everything” is crashing into economic reality. CFOs want accountability. Engineering teams are scrambling for visibility. The result? A perfect storm that’s rapidly pushing Financial Operations, or FinOps, into the spotlight.

The waste isn’t spread evenly across cloud services. Compute resources take the biggest hit, with over-provisioned virtual machines running at 15 percent utilization rates. Storage costs spiral upward through poor data lifecycle management. Network charges pile up through badly designed inter-service communication. These patterns are predictable, measurable, and fixable—if you know what to look for.

FinOps Goes Mainstream

The FinOps Foundation has seen explosive growth, with membership expanding by 200 percent over just two years. This surge isn’t just trend-chasing. It reflects a hard truth: cloud cost management requires dedicated discipline, specialized tooling, and teams that actually talk to each other.

Organizations are learning that FinOps maturity follows a predictable path. Stage one involves basic cost visibility and panic responses to billing surprises. Stage two introduces some governance through budgets, alerts, and approval workflows. Stage three achieves real optimization through automated rightsizing, committed use discounts, and workload-aware scheduling.

The most advanced organizations reach stage four: predictive cost modeling that connects with business planning. These companies treat cloud spending as a strategic lever, not just another line item. They forecast infrastructure needs based on product roadmaps. They model cost impacts during architecture reviews. They optimize for total cost of ownership, not just monthly sticker shock.

Smart Purchasing Strategies Drive Immediate Savings

Smart enterprises are using committed use agreements to slash costs. Reserved instances and savings plans are delivering 40 to 60 percent bill reductions for predictable workloads. These aren’t small improvements—they’re fundamental changes to cloud economics that hit the bottom line hard.

The trick is workload classification and commitment matching. Baseline production systems with steady resource requirements become perfect candidates for three-year reserved capacity. Development and testing environments work well with one-year commitments and convertible options. Dynamic workloads stay on-demand for maximum flexibility.

Spot and preemptible instances are changing machine learning operations completely. Most ML training workloads now run on interruptible compute, achieving 70 to 90 percent cost savings compared to on-demand pricing. Advanced orchestration platforms handle interruptions smoothly through checkpointing and automatic restart mechanisms. This approach requires some architectural sophistication but delivers incredible economic efficiency.

Sophisticated organizations are building layered commitment strategies. They use reserved instances for baseline capacity, utilize savings plans for variable growth, and supplement with spot instances for burst workloads. Tools like AWS Cost Explorer provide the analytics foundation for continuously optimizing these purchasing decisions.

Multi-Cloud Complexity Creates New Challenges

Multi-cloud adoption is speeding up, driven by vendor diversification strategies and best-of-breed service selection. Organizations are discovering that different cloud providers excel in different areas. AWS dominates in breadth and maturity. Google Cloud leads in data analytics and machine learning. Microsoft Azure plays nicely with enterprise software stacks.

But multi-cloud strategies introduce operational complexity that directly impacts cost management. Each provider uses different pricing models, discount structures, and billing cycles. Cost allocation becomes exponentially harder when workloads span multiple platforms. Governance policies must account for provider-specific quirks while maintaining consistent standards.

The solution involves platform-agnostic FinOps tooling and standardized cost allocation methodologies. Leading organizations are investing in unified cost management platforms that normalize billing data across providers. They’re implementing shared tagging strategies that work across AWS, Azure, and Google Cloud. They’re building cost models that abstract away provider-specific pricing complexities.

Serverless Architecture Eliminates Idle Waste

Serverless computing is the ultimate expression of pay-per-use cloud economics. Event-driven architectures powered by functions, containers, and managed services eliminate idle resource waste for sporadic workloads. Organizations are seeing 60 to 80 percent cost reductions when migrating appropriate workloads to serverless platforms.

The transformation goes beyond simple function-as-a-service implementations. Modern serverless architectures combine AWS Lambda with API Gateway, DynamoDB, and S3 for complete application stacks. Google Cloud Functions integrate with Pub/Sub and Firestore for real-time data processing. Azure Functions connect with Logic Apps and Cosmos DB for workflow automation.

Success requires rethinking application architecture around event-driven patterns. Monolithic applications must break down into smaller, stateless functions. Data storage moves from persistent databases to managed services with automatic scaling. Authentication shifts from session-based to token-based models. These changes require significant engineering investment but deliver compelling economic returns.

The Road Ahead

Cloud cost optimization is evolving from reactive expense management to proactive business enablement. Organizations that master FinOps principles today will gain competitive advantages that compound over time. They’ll deploy new services faster because cost implications are understood upfront. They’ll scale more efficiently because resource allocation follows data-driven policies. They’ll innovate more boldly because cloud economics support experimentation rather than constrain it.

Success belongs to organizations that treat cloud spending as a strategic capability, not just an operational expense. As cloud services continue expanding and pricing models grow more complex, FinOps maturity will separate industry leaders from followers. The question isn’t whether your organization needs FinOps discipline. The question is how quickly you can develop it.

Page 10 of 12

Powered by WordPress & Theme by Anders Norén