Deep dives into software, hardware, and the ideas reshaping how we build things.

Category: Default Page 9 of 12

Start Here: Four Distributed Systems Patterns That Actually Matter

Why Most Engineers Get This Wrong

After fifteen years of building distributed systems, I’ve watched countless teams jump straight into microservices or event sourcing without understanding the fundamentals. They read about Netflix’s architecture and think they need the same complexity on day one. The reality is simpler and harder: you need to master a handful of core patterns before anything else makes sense.
Start Here: Four Distributed Systems Patterns That Actually Matter

Most distributed systems fail not because of exotic edge cases, but because teams skipped the basics. They never learned proper service communication. They never understood data consistency models. They built on sand and wondered why everything collapsed under load.

The four patterns I’m sharing here aren’t trendy. They’re basic building blocks. Master these first, and you’ll have the vocabulary to tackle any distributed system problem. Skip them, and you’ll spend years debugging mysteries that shouldn’t exist.

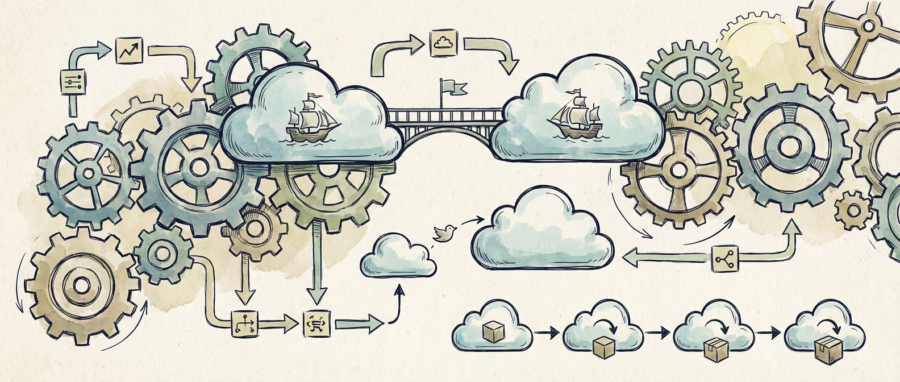
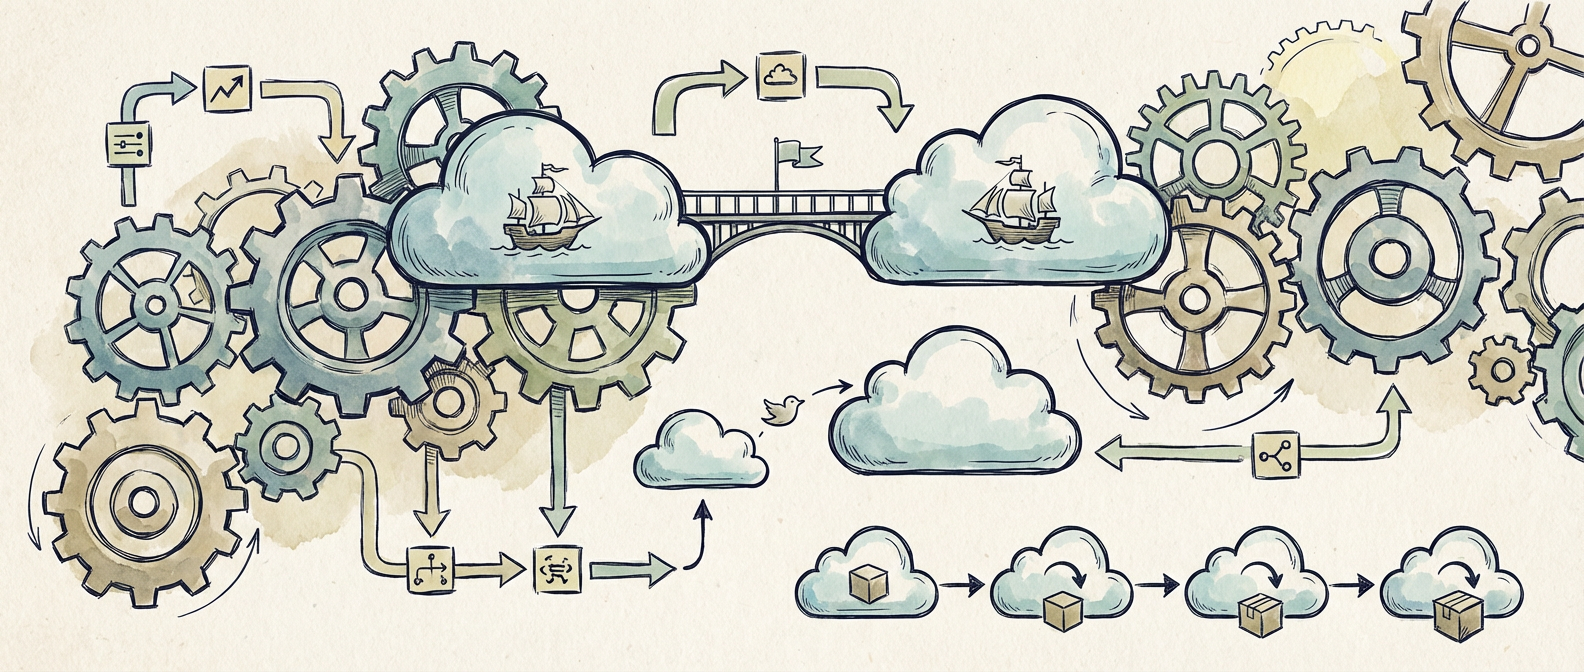
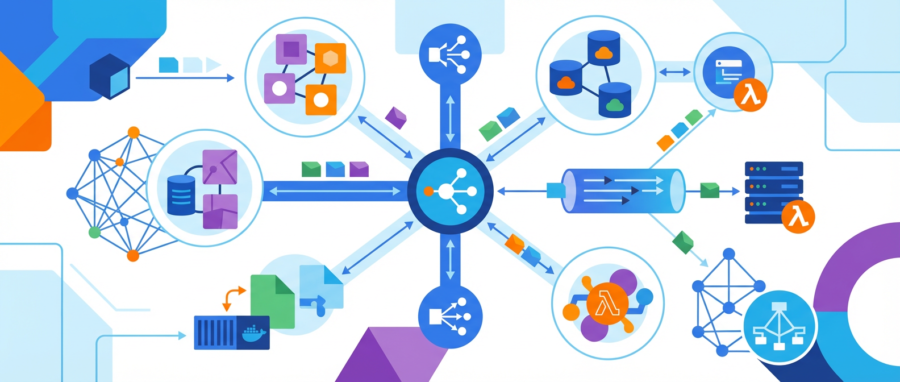
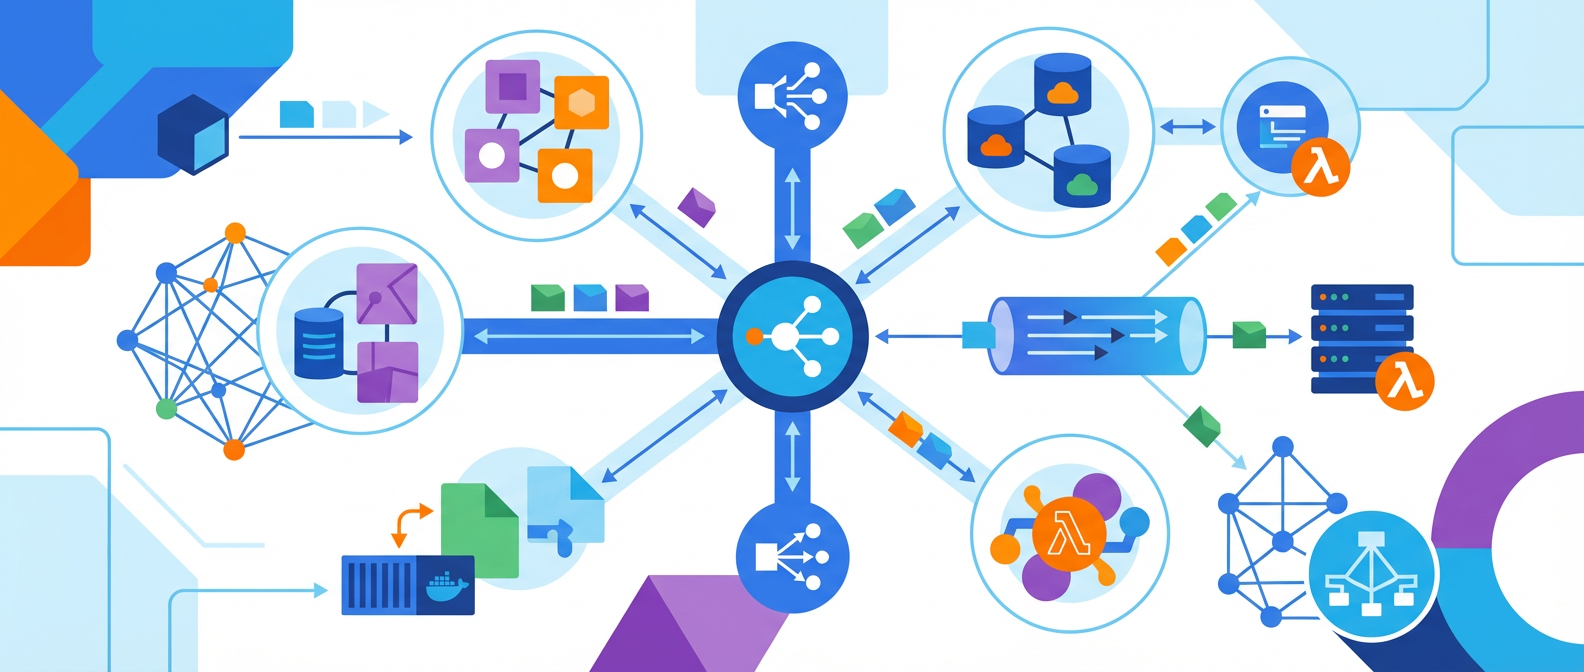
Illustration for Start Here: Four Distributed Systems Patterns That Actually Matter

Request-Response: Your First Building Block

Every distributed system starts with one service calling another. Sounds trivial, but this is where most teams make their first big mistakes. The pattern itself is straightforward: Service A sends a request to Service B and waits for a response. The devil is in the implementation details.

Start with synchronous HTTP calls between services. Yes, it’s not the most elegant solution, but it’s predictable and debuggable. When Service A calls Service B and gets an error, you know immediately what happened. When you’re starting out, this clarity beats performance optimizations every time.

Add timeouts from day one. I’ve seen systems brought down by a single slow dependency because no one thought to set a timeout. Start with generous timeouts and tighten them as you understand your system’s behavior. A five-second timeout might seem long, but it’s infinitely better than waiting forever.

Build retry logic with exponential backoff. When Service B is temporarily down, you don’t want Service A hammering it with requests every millisecond. Wait a bit. Then wait a bit longer. Your future self will thank you when you’re not debugging retry storms at 3 AM.

Circuit Breaker: Failing Fast When Things Go Wrong

The circuit breaker pattern has saved my sanity more times than I can count. It’s dead simple: when a dependency fails repeatedly, stop calling it for a while. Let it recover instead of making things worse with continued requests.

Think of it like the circuit breaker in your house. When too much current flows through, it trips and cuts the power. In software, when too many requests to a service fail, the circuit opens and starts rejecting new requests immediately. This prevents cascade failures where one slow service brings down everything that depends on it.

You need three states: closed, open, and half-open. Closed means everything works normally. Open means the circuit has tripped and requests fail immediately. Half-open is the testing state where you allow a few requests through to see if the service has recovered.

Start with simple thresholds. If five requests in a row fail, open the circuit. Keep it open for thirty seconds, then allow one test request through. If that succeeds, close the circuit. If it fails, stay open for another thirty seconds. These numbers aren’t magic, but they’re a reasonable starting point that you can tune based on your system’s behavior.

Event-Driven Architecture: Loosening the Coupling

Request-response works great until you need to update multiple services when something changes. That’s when event-driven patterns become necessary. Instead of Service A calling Service B, Service C, and Service D directly, Service A publishes an event and lets interested services subscribe to it.

Start with a simple message broker like Redis or RabbitMQ. Don’t jump straight to Kafka unless you’re already handling thousands of events per second. The concepts are the same, but the operational complexity is vastly different. Learn the pattern first, optimize for scale later.

Design events as immutable facts about what happened, not commands about what should happen. “UserRegistered” is better than “SendWelcomeEmail.” The first describes something that happened. The second couples the event to a specific action, making it harder to add new behaviors later.

Handle failures gracefully with dead letter queues. When a service can’t process an event, don’t let it disappear into the void. Send it to a special queue where you can investigate and potentially retry it later. This visibility into failures is crucial for maintaining system reliability.

Data Consistency: Choosing Your Guarantees

Data consistency in distributed systems isn’t binary. You don’t choose between consistent and inconsistent. You choose which guarantees to make and where to make them. This is probably the most misunderstood aspect of distributed systems design.

Start with eventual consistency for most use cases. It’s not as scary as it sounds. When a user updates their profile, it’s usually fine if different services see the change at slightly different times. The system will converge to a consistent state, just not immediately.

Use strong consistency only when you absolutely need it. Banking transactions, inventory management, and other business operations often require immediate consistency. But recognize that strong consistency comes with tradeoffs in performance and availability.

Use saga patterns for distributed transactions. When you need to update data across multiple services atomically, break the operation into a series of smaller transactions. If something fails halfway through, you have a clear rollback path. It’s more complex than a database transaction, but it’s the reality of distributed systems.

Building Your Foundation

These four patterns form the foundation of every distributed system I’ve built. They’re not the most exciting topics, but they’re the difference between a system that works and one that collapses under its own complexity. Start here. Get comfortable with request-response communication, circuit breakers, events, and consistency models.

Pick one pattern and implement it properly in a small project. Don’t try to use all four at once. Understand how it behaves under load, how it fails, and how to debug it when things go wrong. Then move to the next pattern. This foundation will serve you well as you tackle more complex challenges in distributed systems architecture.


Why Most Security Assessments Miss the Point (And How to Fix Yours)

The Assessment Theater We’ve All Seen

I’ve watched teams spend months running automated scanners against production systems, generating thousand-page reports that nobody reads. The executives get their compliance checkboxes filled. The security team points to impressive vulnerability counts. Everyone feels productive until the breach happens through a completely different vector that was never tested.

Why Most Security Assessments Miss the Point (And How to Fix Yours)

This is assessment theater, not security. After fifteen years of building and breaking systems across finance, healthcare, and critical infrastructure, I’ve learned that most vulnerability assessments optimize for the wrong outcomes. They measure what’s easy to count instead of what actually matters for your threat model.

The real problem isn’t the tools or techniques. We’ve turned security assessment into a factory process without understanding what we’re trying to achieve. We think motion equals progress, and that checking every box somehow reduces meaningful risk.

Illustration for Why Most Security Assessments Miss the Point (And How to Fix Yours)
Illustration for Why Most Security Assessments Mis the Point (And How to Fix Yours)

What Actually Works: Risk-Driven Assessment Design

Good security assessment starts with a simple question that most teams skip: what are we protecting, and from whom? I’m not talking about generic threat modeling exercises. I mean understanding your specific attack surface in the context of who wants your data and how they’ll likely come after it.

I’ve seen this done right exactly twice in my career. Both times the security teams spent more time in business meetings than scanning networks. They understood the difference between a publicly-exposed API that processes financial transactions and an internal development server with test data. Their assessments focused resources where they mattered.

The approach that consistently produces useful results has three parts: classify assets by business impact, profile threat actors based on your industry and size, and map realistic attack paths. Everything else is just noise.

This means accepting that you can’t test everything equally. That internal HR database gets different treatment than your customer payment system. This makes teams uncomfortable because we’re trained to be thorough, but it’s the only way to use limited assessment resources effectively.

The Automation Trap and When Manual Testing Matters

Automated vulnerability scanners are necessary but not enough. They find the obvious stuff that any decent attacker already knows about. Real value comes from manual testing that understands your specific implementation choices and business logic.

I’ve broken into systems through race conditions in custom authentication flows, business logic flaws in approval workflows, and privilege escalation bugs in homegrown admin interfaces. None of these showed up in automated scan reports. They required understanding how the application actually worked and thinking like someone trying to abuse that functionality.

The right approach combines automated discovery with manual exploitation. Use scanners to map attack surface and catch obvious misconfigurations. Then focus human effort on high-value targets that automated tools can’t properly test: custom applications, privileged access controls, and business process integrations.

This doesn’t mean ditching automation. It means understanding what it can’t do and designing workflows that make human expertise more effective, not trying to replace it with compliance checklists.

Building Assessments That Drive Real Security Improvements

The best vulnerability assessments produce findings that development and operations teams can actually act on. This requires understanding their constraints, priorities, and deployment processes. Security recommendations that ignore how things actually work get filed under “someday maybe” and forgotten.

Practical assessment approaches work with existing development workflows. They put findings in formats that fit into issue tracking systems. They include proof-of-concept exploits that show business impact rather than just technical cleverness. They suggest fixes that work within current architectural constraints.

I’ve learned to present findings as business scenarios rather than vulnerability categories. Instead of “SQL injection in user registration form,” try “attacker can access customer payment history through registration page manipulation.” The technical details matter for fixing it, but business context drives priority.

This requires assessment teams that understand both security and software development. You need people who can read code, understand deployment pipelines, and explain attack scenarios to non-technical stakeholders. These skills matter more than certifications or tool expertise.

Measuring What Matters: Beyond Vulnerability Counts

Traditional assessment metrics push teams toward the wrong goals. Vulnerability counts encourage finding more issues rather than fixing important ones. Time-to-fix metrics reward quick patches over architectural improvements. Compliance percentages promote checkbox thinking over actual risk reduction.

Better metrics focus on reducing attack paths and minimizing exposure. How many ways can an external attacker reach sensitive data? How much access does a compromised internal system provide? How quickly can you detect and respond to the attack scenarios you’ve identified?

These metrics take more work to measure, but they connect assessment activities with actual security outcomes. They push teams to think about systemic improvements rather than individual vulnerability patches. They support conversations about security architecture instead of just incident response.

Organizations that get this right treat vulnerability assessment as ongoing security engineering rather than periodic compliance theater. Their assessment programs influence architecture decisions, development standards, and operational procedures. They measure progress by reduced attack surface rather than closed tickets.

Building better assessment approaches requires honestly evaluating your current methods and committing to prioritize differently. The techniques exist, but implementation demands organizational willingness to measure and improve what actually matters for security. What gaps have you spotted in your current assessment approach, and what’s stopping you from fixing them?

Why Your Database Performance Problems Aren’t Actually About the Database

The Monday Morning Query That Changed Everything

At 9:47 AM on a Tuesday, our primary PostgreSQL instance started throwing connection timeouts. The monitoring dashboard lit up like a Christmas tree. Database CPU spiked to 98%. Active connections maxed out at 200. The obvious culprit seemed to be the database itself.

Three days later, after digging into connection pooling configurations, query execution plans, and index strategies, we discovered the real problem. A single microservice was opening 15 new database connections for every API request instead of reusing existing ones. The database wasn’t slow. The application was flooding it with unnecessary work.

This pattern repeats itself in every organization I’ve worked with over the past decade. Teams blame the database first, optimize second, and ask questions last. The result is expensive hardware upgrades that don’t solve the underlying issues.

Connection Pooling: The Fundamental Mistake Everyone Makes

Most applications treat database connections like HTTP requests. They open one, use it, and discard it. This approach works fine for a handful of users but becomes catastrophic under load. Each PostgreSQL connection consumes roughly 8MB of memory plus overhead for maintaining session state.

I’ve seen Rails applications configured with Puma workers that spawn 16 threads each, multiplied by 6 application servers, creating 96 potential database connections per deployment. Without proper pooling, a traffic spike can easily exhaust your database’s connection limit before you even touch the actual query processing capacity.

The fix isn’t just enabling connection pooling. You need to understand your application’s actual concurrency patterns. PgBouncer with transaction-level pooling can reduce connection overhead by 80% in most web applications. But you need to profile your specific workload first. Connection pool size should match your database’s `max_connections` setting divided by the number of application instances, not some arbitrary default.

Index Strategy: Beyond the Obvious B-Tree

Every developer knows to add indexes. Few understand the performance characteristics of different index types under varying conditions. B-tree indexes work well for equality and range queries but become inefficient for pattern matching or complex WHERE clauses involving multiple columns.

Consider a user table with email, created_at, and status columns. The obvious approach is separate indexes on each column. The better approach depends on your actual query patterns. If you frequently search for active users created within date ranges, a composite index on (status, created_at) will outperform individual indexes because PostgreSQL can satisfy the entire query with one index scan.

Partial indexes take this further. An index on `WHERE status = ‘active’` only indexes active users, reducing index size and maintenance overhead. For a table where 90% of users are active, this can cut index storage requirements significantly while improving query performance on the most common access pattern.

Query Execution Plans: Reading the Real Story

EXPLAIN ANALYZE output tells you what actually happened, not what you think happened. The difference matters when you’re debugging performance issues under production load. Cost estimates in query plans are useful for comparison, but actual execution time and row counts reveal the truth.

I recently debugged a report query that consistently took 45 seconds despite having proper indexes. The EXPLAIN plan showed the optimizer choosing a nested loop join instead of a hash join for two large tables. The statistics were stale. After running ANALYZE on both tables, the same query completed in 800 milliseconds.

Sequential scans aren’t inherently bad. For small tables or when you need most rows, sequential scans can be faster than index lookups. PostgreSQL’s cost-based optimizer makes these decisions based on table statistics. If your production query patterns don’t match the optimizer’s assumptions, you need better statistics or query hints.

Hardware and Configuration: The Expensive Band-Aid

Throwing hardware at database performance problems is expensive and often ineffective. I’ve seen teams upgrade from 32GB to 128GB of RAM to solve memory pressure issues caused by poorly configured shared_buffers settings. The database was using only 8GB for query caching because someone copied configuration values from a different workload.

SSD storage helps with random I/O patterns, but it won’t fix queries that read entire tables unnecessarily. Network bandwidth matters more than CPU cores for most OLTP workloads. Database CPU usage above 70% usually indicates application-level problems, not hardware constraints.

Configuration tuning requires understanding your specific workload. The default PostgreSQL configuration assumes a database running on a system with limited resources. For production systems, work_mem should be sized based on the number of concurrent queries and available system memory. Setting it too high causes memory pressure. Setting it too low forces disk-based sorting and hash operations.

Monitoring: Measuring What Actually Matters

Database dashboards often focus on system-level metrics like CPU and memory usage. These matter, but application-level metrics tell the real story. Query response time percentiles reveal performance degradation before system resources become constrained.

Lock contention shows up as high wait times for specific lock types, not high CPU usage. PostgreSQL’s pg_stat_activity view shows you exactly which queries are blocked and why. Most monitoring tools don’t expose this information by default.

The key insight is tracking query performance over time, not just system health. A query that took 50ms last month but takes 200ms today indicates data growth or plan regression, even if system metrics look normal.

The Real Performance Audit

Database performance problems are rarely database problems. They’re usually application architecture decisions showing up as database symptoms. Before you optimize indexes or upgrade hardware, audit your application’s database interaction patterns. Count actual queries per request. Measure connection lifecycle overhead. Profile memory allocation in query processing.

The fastest query is the one you don’t run. The most efficient connection is the one you reuse. The best index is the one that eliminates unnecessary table scans. Start there, not with the database configuration.

Kubernetes Production Deployment Strategies: What Actually Works After Five Years in the Trenches

The Blue-Green Mirage

Everyone talks about blue-green deployments like they’re the holy grail. Two identical environments. Switch traffic. Roll back instantly if things go wrong. Sounds perfect until you try to run it at scale with stateful services and realize you need double the infrastructure for everything.

Kubernetes Production Deployment Strategies: What Actually Works After Five Years in the Trenches

I spent eight months implementing blue-green for a financial services platform. The theory was solid. The reality was brutal. Database migrations became a nightmare. How do you keep two identical databases in sync when one environment is receiving live traffic? We tried replication with a lag, but even a few seconds of delay caused data consistency issues that made our compliance team very unhappy.

The infrastructure costs were eye-watering. We weren’t just doubling compute resources. We needed duplicate storage, duplicate network configurations, duplicate monitoring setups. The monthly AWS bill made our CFO question whether we’d accidentally launched a cryptocurrency mining operation.

Blue-green works beautifully for stateless applications with simple data flows. But if you’re dealing with complex microservices architectures where services talk to each other and maintain state, the coordination overhead will eat you alive. We eventually scaled back to using blue-green only for our most critical user-facing services.

Illustration for Kubernetes Production Deployment Strategies: What Actually Works After Five Years in the Trenches

Rolling Deployments: The Pragmatic Choice

Rolling deployments became our bread and butter. Kubernetes makes this almost trivial with proper readiness and liveness probes. You update your deployment spec, and the controller methodically replaces pods one by one. Simple. Reliable. Cost-effective.

The devil lives in the configuration details. We learned to set maxUnavailable to 25% and maxSurge to 50% after watching too many deployments crawl along at one pod per minute. For a service running 20 replicas, this meant we could have up to 5 pods down and 10 extra pods spinning up simultaneously. The math matters when you’re trying to maintain SLA during peak traffic.

Health checks are where most teams stumble. Your readiness probe needs to verify that your service can actually handle requests, not just that the process started. We use a custom endpoint that checks database connectivity, external service dependencies, and cache initialization. A pod that reports ready but can’t fulfill requests will ruin your deployment.

Circuit breakers saved us countless times. When a new version had performance issues, our services would automatically stop routing traffic to degraded pods. The deployment would stall instead of cascading failure across the entire system. We use Hystrix patterns in our Java services and similar logic in our Go applications.

Canary Deployments: When You Need to Sleep at Night

Canary deployments require more orchestration but give you the confidence to ship changes without losing sleep. We route 5% of traffic to the new version and monitor key metrics for 30 minutes. If everything looks good, we gradually increase to 25%, then 50%, then 100%.

Istio made this possible for us, but the learning curve was steep. Traffic splitting, destination rules, virtual services. The YAML configurations look simple until you need to debug why 5.2% of your traffic is going to the canary instead of 5%. We spent weeks fine-tuning the mesh configuration.

Automated rollbacks based on metrics are essential. We monitor error rates, response times, and business-specific metrics like successful payment processing. If any metric crosses a threshold, the deployment automatically rolls back. This happened twice last month when a seemingly innocent library update increased memory usage by 40%.

Feature flags complement canary deployments beautifully. Even if the new code is deployed, you can toggle features off instantly without rolling back the entire deployment. We use LaunchDarkly for this, integrated with our monitoring stack. When a feature causes issues, we can disable it in seconds while keeping the rest of the deployment intact.

The Database Migration Battlefield

Database schema changes are where deployment strategies go to die. You can’t just update your application code and hope the database keeps up. We learned this the hard way during a migration that brought down our primary service for six hours.

Forward compatibility is non-negotiable. Your current application version must work with both the old and new database schemas. This means deploying schema changes first, then updating application code to use new columns or tables. We use Liquibase for Java applications and golang-migrate for our Go services.

Zero-downtime migrations require careful choreography. Adding columns is safe. Renaming or dropping columns requires multiple deployment cycles. First, you add the new column and dual-write to both old and new. Then you update application code to read from the new column. Finally, you drop the old column in a later release.

We maintain separate migration pipelines for schema changes and application deployments. Database migrations run first during maintenance windows when traffic is low. Application deployments happen during business hours when we can monitor the impact. This separation has prevented more outages than I can count.

Lessons from Five Years of Production Deployments

Monitoring and observability matter more than the deployment strategy itself. You need to know immediately when something goes wrong. We use Prometheus for metrics, Jaeger for distributed tracing, and structured logging with correlation IDs. The three-signal approach works: metrics tell you what’s broken, logs tell you why, and traces tell you where.

Rollback speed determines your sleep quality. We can roll back any service in under two minutes because we keep the previous three versions readily available. Container images are tagged with git commit hashes and stored in our private registry. The rollback process is automated through our CI/CD pipeline.

Cultural changes matter as much as technical ones. We adopted blameless post-mortems and transparent communication about deployment issues. Teams share learnings across the organization. When the payments team discovered that connection pooling settings caused issues during deployments, every other team updated their configurations proactively.

Production deployment strategies aren’t solved problems you implement once. They’re evolving practices that adapt to your specific constraints, risk tolerance, and organizational maturity. The best strategy is the one your team can execute reliably under pressure. What deployment challenges are you facing in your environment? I’d be curious to hear how you’ve adapted these patterns to your specific context.

The Evolution of Vulnerability Assessment: Lessons from Twenty Years in the Trenches

When Automated Scanners Weren’t Enough

Back in 2003, I thought I had security assessments figured out. Run Nessus, maybe throw in some Nmap for good measure, generate a report, and call it done. The client got their compliance checkbox, we got paid, and everyone went home happy. Then I walked into a financial services company that had been running these automated scans quarterly for two years straight. Clean reports every time. Zero critical findings.

The Evolution of Vulnerability Assessment: Lessons from Twenty Years in the Trenches

Three hours into manual testing, I had administrative access to their core banking system through a SQL injection vulnerability that every scanner had missed. The application was filtering common attack strings but choking on Unicode-encoded payloads. No tool had thought to test that combination. That day taught me something I still carry with me: automation finds the obvious stuff, but the dangerous vulnerabilities hide in the gaps between what tools expect to find.

The financial services incident forced me to completely rethink my approach. I started developing hybrid methods that treated automated tools as reconnaissance, not assessment. Tools like Burp Suite and custom scripts became my primary weapons, while traditional vulnerability scanners got pushed back to the initial discovery phase. This shift changed everything about how I approached security assessments. I realized I’d been thinking about this backwards.

Illustration for The Evolution of Vulnerability Assessment: Lessons from Twenty Years in the Trenches

The False Security of Compliance-Driven Testing

Most organizations approach vulnerability assessments backward. They start with compliance requirements and work their way down to technical testing. I’ve seen countless PCI DSS assessments that focused on checking boxes rather than finding real security gaps. The result is always the same: a clean report that satisfies auditors while leaving critical systems exposed.

Real attackers don’t follow compliance frameworks. They exploit business logic flaws, abuse legitimate functionality, and chain together minor issues into major breaches. I learned this lesson the hard way during a healthcare assessment where the automated scan showed minimal findings, but manual testing revealed that any employee could access patient records by manipulating session parameters. The vulnerability existed entirely within the application’s intended functionality, making it invisible to traditional scanning approaches.

The most effective assessment approach I’ve developed treats compliance as a minimum baseline, not a target. Start with threat modeling specific to the organization’s business model and attack surface. Map out the attack paths that would matter to actual adversaries. Then layer in the compliance requirements as a final verification step. This approach catches both the technical vulnerabilities and the business logic flaws that compliance-driven testing consistently misses. It’s messier, takes longer, but finds the stuff that actually matters.

Building Assessment Methods That Actually Work

After two decades of breaking things professionally, I’ve settled on a four-phase approach that balances thoroughness with practical constraints. Phase one is pure reconnaissance: passive information gathering, automated scanning, and service enumeration. This phase identifies the obvious attack surface without alerting defensive systems. Phase two focuses on authentication and session management, systematically testing how the application handles user identity and access controls.

Phase three is where the real work happens: manual testing of business logic, authorization flaws, and complex attack chains. This phase requires understanding how the application actually works, not just how it’s supposed to work. I spend most of my assessment time here, crafting custom payloads and exploring edge cases that automated tools never consider. Phase four validates findings and tests remediation effectiveness, making sure that fixes actually solve the underlying problems rather than just blocking specific attack vectors.

The key insight that transformed my approach was treating each phase as a feedback loop rather than a linear progression. Findings from manual testing often reveal new automated testing opportunities. Authorization flaws discovered in phase three might expose additional services that need reconnaissance. The process becomes iterative, with each cycle revealing deeper layers of the attack surface. It’s more organic than the rigid frameworks most consultants push.

The Human Element in Technical Assessment

Technology evolves faster than assessment methods. The approach that worked perfectly for traditional web applications falls apart when applied to modern cloud-native architectures, API-driven systems, and containerized environments. I’ve had to rebuild my methods multiple times as the technology landscape shifted underneath established practices. It’s frustrating, but also keeps the work interesting.

The most significant challenge isn’t technical complexity, it’s maintaining assessment quality under business pressure. Clients want faster results and cheaper prices, pushing toward automated solutions that miss the sophisticated vulnerabilities that matter. I’ve learned to structure assessments as hybrid engagements: automated tools handle the broad surface area scanning, while manual testing focuses on high-value targets and complex attack scenarios.

Experience matters more than tools in this field. A skilled assessor with basic tools will find more critical vulnerabilities than an automated scanner with perfect configuration. The approach needs to amplify human expertise, not replace it. This means building processes that help assessors think like attackers while maintaining the systematic rigor that ensures complete coverage of the attack surface. You can’t automate intuition.

Practical Lessons for Building Better Assessment Programs

The most effective vulnerability assessment programs treat assessment as an ongoing conversation between security teams and development organizations, not a periodic audit. Regular, lightweight assessments catch problems early when they’re cheap to fix. Annual comprehensive assessments become validation exercises rather than discovery missions. This approach requires different methods for different assessment types: quick architectural reviews for new features, focused testing for high-risk changes, and comprehensive assessments for major releases.

Integration with development workflows transforms assessment from overhead into value creation. When vulnerability testing happens automatically in CI/CD pipelines, developers get immediate feedback about security issues in their code. When assessment approaches align with development practices, security findings become actionable technical debt rather than compliance obligations. The approach needs to speak the language of software development, not just security operations.

After twenty years of evolution, my assessment methods have become less about following predetermined steps and more about adapting systematic thinking to unique technical environments. The best assessments feel less like audits and more like collaborative problem-solving sessions where security expertise helps organizations understand their real risk exposure. That’s the assessment approach that actually moves the security needle.

What methods have you found most effective in your own security assessment work? I’m always interested in hearing how other practitioners approach the balance between systematic coverage and adaptive expertise, especially in rapidly evolving technical environments.

The Technical Debt Wars: Hard-Won Lessons from the Battlefield

When the Chickens Come Home to Roost

I’ve been writing production code for fifteen years, and I can tell you that technical debt isn’t just some abstract concept you read about in engineering blogs. It’s the 3 AM phone call when the authentication service crashes because someone decided to “temporarily” store session tokens in memory back in 2019. It’s the three-week feature that stretches to three months because the codebase has grown into a labyrinth of shortcuts and workarounds.

The Technical Debt Wars: Hard-Won Lessons from the Battlefield

The hardest lesson I learned came during my stint at a fintech startup where we put speed above everything else. We shipped features fast, impressed investors, and hit every deadline. For eighteen months, we were heroes. Then the weight of accumulated shortcuts started crushing us. Simple changes required touching dozens of files. The test suite took hours to run and failed randomly. New engineers spent weeks just understanding how data flowed through our system.

That experience taught me something I wish I’d learned earlier: technical debt isn’t inherently evil, but treating it like credit card debt will destroy you. You can’t just make minimum payments and hope it goes away.

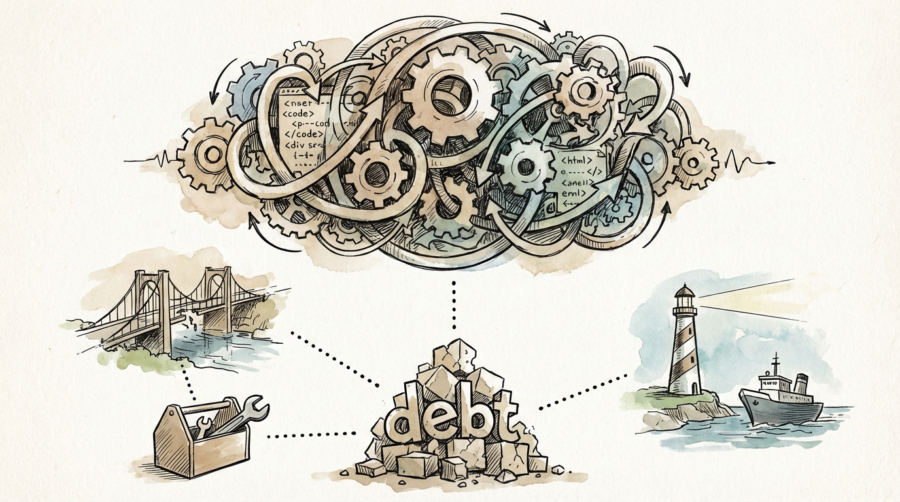
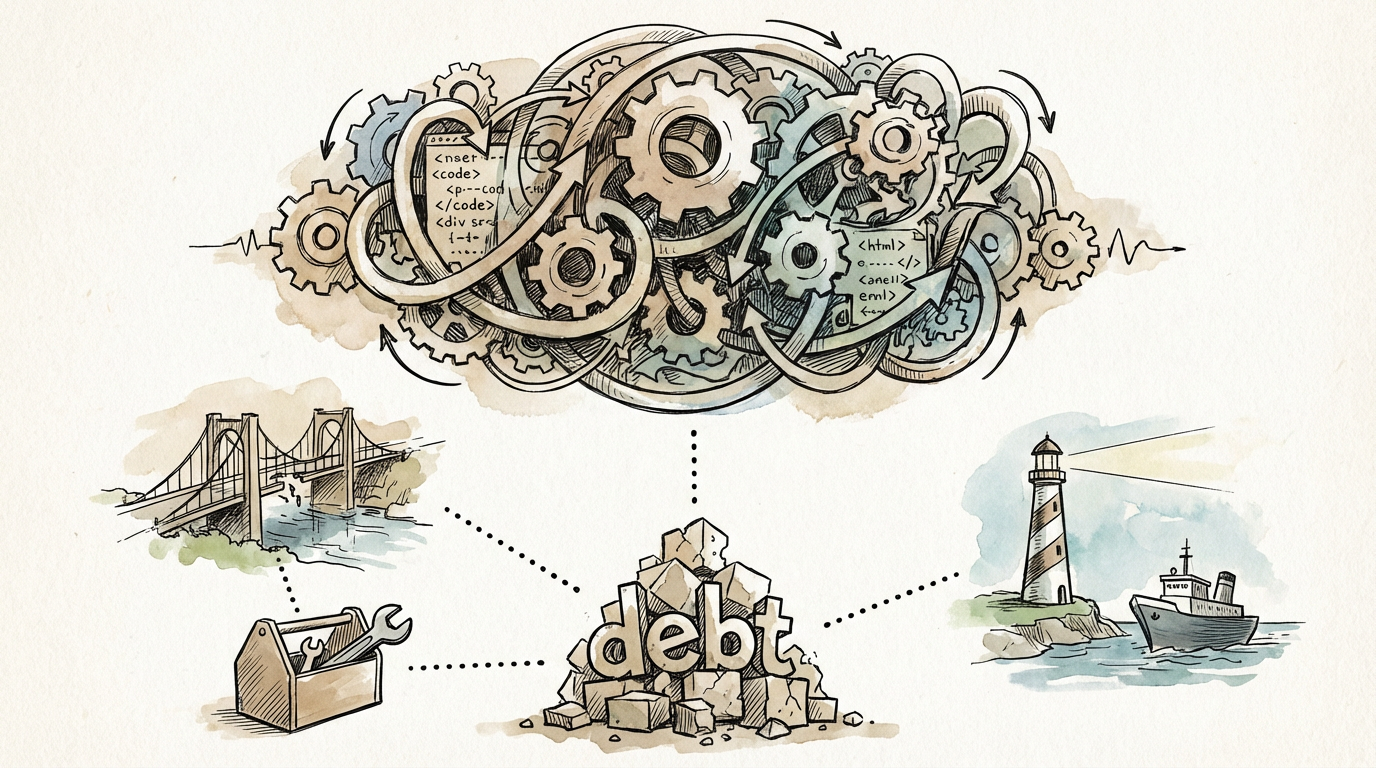
Illustration for The Technical Debt Wars: Hard-Won Lessons from the Battlefield

The Archaeology of Bad Decisions

Before you can fix technical debt, you have to understand what you’re dealing with. Most teams approach this backwards. They start by identifying what feels broken today, but that’s just treating symptoms. The real work is archaeological.

Start with your deployment pipeline. How long does it take to get a one-line change into production? If it’s more than thirty minutes, you’ve got process debt. Look at your test coverage, but more importantly, look at test execution time. Tests that take forever to run don’t get run. That’s confidence debt, and it’s expensive.

Then dig into the code itself. I use a simple heuristic: if explaining a piece of code to a new team member requires more than two sentences, it’s probably carrying debt. Complex conditional logic, deeply nested functions, and classes with more than five dependencies are all red flags. Document these patterns, but don’t try to fix them yet.

The most insidious debt is architectural. This shows up as tight coupling between components that should be independent, or as business logic scattered across multiple layers. I once inherited a system where user authentication logic lived in fourteen different files. Every auth-related feature required touching the entire codebase. It was a nightmare.

Strategic Debt Reduction

Here’s what doesn’t work: declaring a “tech debt sprint” and hoping to clean everything up in two weeks. I’ve seen this approach fail spectacularly because it treats all debt as equivalent. It’s not.

Categorize your debt by impact and effort. High-impact, low-effort fixes go first. These might be adding logging to black-box functions, extracting configuration from hardcoded values, or writing integration tests for critical user flows. These changes provide immediate value and build momentum.

For larger architectural debt, I use the strangler pattern religiously. Don’t rewrite the monolith. Gradually replace it. When you need to add a feature to a problematic area, write the new functionality cleanly and slowly migrate existing behavior. This approach lets you improve the system while delivering business value.

The key is making debt reduction part of regular feature work, not a separate activity. Every pull request should leave the codebase slightly better than it was. This means refactoring as you go, adding tests for code you touch, and improving documentation for systems you modify.

Building Debt Resistance

Prevention is more effective than cures, but it requires discipline and the right organizational support. Code reviews are your first line of defense, but only if reviewers actually have time to think critically about the code they’re reviewing. Rubber-stamp reviews create more debt than no reviews at all.

I’ve found that pairing debt metrics with business metrics works better than tracking technical metrics alone. Instead of reporting “test coverage decreased by 5%,” report “feature delivery time increased by 30% because of debugging.” Business stakeholders understand time and reliability. They don’t inherently understand cyclomatic complexity.

Automated tooling helps, but tools without context create noise. Static analysis that flags every function longer than twenty lines isn’t useful. Configure your tools to catch the specific problems your team tends to create. If you struggle with database performance, implement query analysis. If you have dependency management issues, add dependency scanning.

The most important preventive measure is cultural. Teams that treat code quality as a shared responsibility create less debt than teams where quality is one person’s job. Make sure everyone understands that shipping fast today by creating problems tomorrow isn’t actually shipping fast.

Living with Perpetual Imperfection

After fifteen years of building software, I’ve accepted that perfect codebases don’t exist at scale. Every system carries some debt, and that’s fine. The goal isn’t elimination. It’s management.

Some debt is strategic. Taking shortcuts to validate product-market fit makes sense, as long as you plan to address those shortcuts once validation succeeds. The problems come when temporary solutions become permanent by neglect, not by choice.

I’ve learned to distinguish between debt that constrains future development and debt that simply offends my aesthetic sensibilities. A function with an ugly name but clear behavior isn’t worth refactoring. A tightly-coupled module that prevents horizontal scaling absolutely is.

The most successful teams I’ve worked with treat technical debt like financial debt: they track it, they budget for it, and they make conscious decisions about when to take it on and when to pay it down. They don’t let it accumulate unchecked, but they also don’t panic when some debt exists.

Managing technical debt is ultimately about making informed tradeoffs under uncertainty. You won’t always get it right, but with experience, you’ll get better at recognizing which shortcuts will haunt you later and which ones are just expedient solutions to real problems. If you’ve got war stories of your own about technical debt battles won or lost, I’d love to hear them.

The Database Performance Lessons That Actually Matter in Your Career

Why Database Performance Skills Define Senior Engineers

After fifteen years of debugging production outages at 3 AM, I can tell you that database performance separates the senior engineers from everyone else. It’s not about knowing every SQL optimization trick or memorizing index types. It’s about understanding that when your application falls over, it’s usually the database choking first.

The Database Performance Lessons That Actually Matter in Your Career

The engineers who get promoted understand this reality. They know that a poorly performing query can take down an entire product launch. They’ve seen million-dollar deals lost because a report took forty-five minutes to run. Most importantly, they’ve learned that database performance isn’t a backend problem or a DBA problem. It’s an engineering problem that touches every layer of your application.

This perspective shift changes everything about how you approach system design. You stop thinking about databases as magical black boxes and start treating them as the critical bottleneck they usually are. That mindset alone will accelerate your career faster than any framework du jour.

Illustration for The Database Performance Lessons That Actually Matter in Your Career

The Performance Fundamentals That Actually Get You Promoted

Indexing strategy reveals more about an engineer’s thinking than any whiteboard interview. I’ve watched countless developers throw indexes at slow queries without understanding the underlying access patterns. The engineers who advance understand that indexes are trade-offs, not free performance wins.

A properly designed composite index can turn a thirty-second query into a fifty-millisecond one. But that same index might slow down your writes by twenty percent. Senior engineers know to measure both sides of this equation. They understand that the order of columns in a composite index matters enormously, and they can explain why without looking it up.

Query analysis becomes second nature when you’ve spent enough time in production systems. You learn to spot the common patterns that destroy performance: the N+1 queries that bring down web applications, the missing WHERE clauses that scan entire tables, the subqueries that could be simple joins. More importantly, you develop intuition for which optimizations matter and which ones are premature.

Connection pooling and transaction management separate the engineers who understand distributed systems from those who just use them. Managing database connections properly prevents the cascading failures that turn small traffic spikes into complete outages. Understanding transaction isolation levels helps you avoid the race conditions that create impossible-to-reproduce bugs.

Reading the Room: When Performance Problems Are Really People Problems

The hardest database performance problems aren’t technical. They’re organizational. That legacy reporting system that takes six hours to run exists because someone made a quick decision three years ago, and now it’s too politically expensive to fix properly.

Learning to navigate these situations builds the soft skills that define engineering leadership. You need to communicate why the current approach won’t scale without making anyone feel stupid. You need to build consensus around technical solutions that require significant engineering investment. You need to translate query execution plans into business impact.

The engineers who advance learn to frame performance problems in terms of user experience and business metrics. They don’t just say “this query is slow.” They say “our checkout flow has a fifteen percent abandonment rate because the payment confirmation takes twelve seconds to load.” That difference in communication gets you the resources to fix things properly.

Database migrations and schema changes reveal how well you understand production systems under pressure. Senior engineers know that altering a large table during business hours can lock up your entire application. They’ve learned to break large migrations into smaller, reversible steps. They understand the cascade effects of schema changes on application code, caching layers, and backup systems.

Building Systems That Don’t Break at 2 AM

Monitoring and alerting separate engineers who maintain systems from those who just build them. You need to understand which database metrics actually predict problems before they happen. CPU utilization spikes are obvious, but connection pool exhaustion, lock wait times, and buffer cache hit ratios tell you much more about system health.

The best database monitoring setups I’ve seen focus on trends rather than absolute numbers. A query that normally takes fifty milliseconds but suddenly takes two hundred milliseconds indicates a problem, even if two hundred milliseconds isn’t objectively slow. Understanding these baseline shifts helps you catch performance degradation before it impacts users.

Capacity planning requires understanding growth patterns that most engineers never consider. User behavior changes seasonally, feature launches create unpredictable load patterns, and database growth rarely scales linearly. The engineers who get promoted anticipate these changes and build systems that gracefully handle unexpected load.

Database backup and recovery strategies reveal how seriously you take production responsibility. It’s not enough to know that backups exist. You need to understand recovery time objectives, test restoration procedures regularly, and know exactly how much data you can afford to lose during different types of failures.

The Career Boost That Comes From Database Expertise

Database performance skills create career opportunities that most engineers never see. Companies desperately need engineers who can diagnose and fix performance problems quickly. The engineer who can walk into a crisis situation and systematically identify bottlenecks becomes indispensable.

This expertise transfers across technologies and industries in ways that framework-specific skills don’t. Whether you’re working with PostgreSQL, MySQL, MongoDB, or DynamoDB, the fundamental principles of performance analysis remain consistent. Understanding data access patterns, identifying bottlenecks, and optimizing for specific workloads applies everywhere.

The debugging methodology you develop from database performance work improves every aspect of your engineering thinking. You learn to form hypotheses, test them systematically, and measure results objectively. You develop patience for complex problems that require careful analysis rather than quick fixes.

What specific database performance challenges are you wrestling with in your current role? The problems that keep you up at night often contain the seeds of your next career breakthrough.

Why Event Sourcing Will Outlive Your Current Database Strategy

The Postgres Migration That Changed Everything

Three years ago, I watched a team spend eight months migrating their user management system from MongoDB to PostgreSQL. They had all the right reasons. Better consistency guarantees. Mature tooling. A DBA who actually understood relational theory. The migration went smoothly until they realized they’d lost something critical: the ability to answer “why did this user’s permissions change last Tuesday?”

This wasn’t a failure of planning. It was a failure to recognize that data storage and data meaning operate on different timescales. Your database choice might change every few years, but the questions your business asks about state transitions remain constant. This distinction is driving a fundamental shift in how we think about distributed system persistence patterns.

Event Sourcing as Infrastructure, Not Feature

Event sourcing isn’t new, but its role is changing from application pattern to infrastructure primitive. Instead of storing current state, you store the sequence of events that led to that state. When Uber needs to reconstruct a ride’s pricing calculation from six months ago, they’re not querying a rides table. They’re replaying the sequence of location updates, surge multipliers, and promotional codes that generated the final fare.

The infrastructure implications are huge. Event stores become the source of truth, while traditional databases become derived views optimized for specific query patterns. PostgreSQL might handle your user lookups, Redis your session cache, and Elasticsearch your search queries. All three stay synchronized by consuming the same event stream. This isn’t eventual consistency by accident. It’s intentional decomposition of concerns.

What makes this pattern particularly compelling is its temporal resilience. Your current read model might be optimized for today’s queries, but next quarter’s analytics requirements won’t force another migration. You’ll build a new projection from the same event history. The cost of being wrong about schema design drops dramatically when schema becomes a view, not the foundation.

Command Query Responsibility Segregation Gets Serious

CQRS used to feel like academic architecture astronautics. That’s changing as read and write scalability requirements diverge at enterprise scale. At GitHub, code pushes generate events consumed by dozens of downstream systems: notification delivery, security scanning, deployment pipelines, and analytics aggregation. The write side focuses on accepting and ordering commands. The read side optimizes for query patterns that couldn’t exist when both lived in the same database.

The operational benefits compound over time. Write-side scaling becomes about event ingestion throughput. Read-side scaling becomes about projection maintenance and query optimization. These are fundamentally different problems requiring different tools and expertise. Your write infrastructure might run on Kafka and EventStore, while your read infrastructure spans PostgreSQL, BigQuery, and specialized vector databases for ML workloads.

This separation also enables failure isolation that traditional CRUD architectures can’t achieve. When GitHub’s code search experiences high latency, it doesn’t impact push operations. The event stream continues flowing while read projections catch up asynchronously. Downtime becomes partial and graceful rather than total and catastrophic.

Saga Patterns for Complex Transactions

Distributed transactions are where most microservice architectures reveal their true complexity. Two-phase commit doesn’t scale across network boundaries or organizational boundaries. Saga patterns are a more resilient alternative by breaking complex operations into sequences of local transactions, each compensatable if later steps fail.

Consider Shopify’s order fulfillment process. Charging payment, reserving inventory, scheduling shipping, and updating customer records happen across different services owned by different teams. A saga orchestrates these steps while maintaining consistency guarantees through compensation rather than locking. If shipping fails after payment succeeds, the saga triggers payment reversal and inventory unreservation automatically.

The implementation complexity shifts from runtime coordination to design-time planning. Each saga step must be idempotent and compensatable. This constraint forces better service boundaries and clearer failure semantics. Teams start thinking about business processes as sequences of state transitions rather than monolithic transactions. The result is more resilient systems that fail predictably and recover automatically.

Looking Forward: Orchestration Becomes Infrastructure

The patterns I’ve described share a common thread: they move complexity from application logic into infrastructure primitives. Event sourcing, CQRS, and sagas are becoming platform capabilities rather than application concerns. Kubernetes operators now manage event store clusters. Service meshes provide built-in saga coordination. Cloud providers offer managed event streaming with exactly-once delivery guarantees.

This infrastructuralization of distributed patterns will accelerate over the next five years. The signal is clear in how major platforms are changing. AWS EventBridge now handles event routing that used to require custom application logic. Google Cloud Workflows provides visual saga orchestration. Azure Service Bus has advanced message ordering and deduplication. These aren’t just convenience features. They’re infrastructure investments in patterns that have proven themselves at scale.

The speculation part: I expect we’ll see specialized databases optimized for event sourcing workloads become as common as traditional OLTP databases. Current event stores like EventStore and Apache Pulsar are early indicators, but purpose-built infrastructure for temporal data patterns will emerge as the default choice for new distributed systems.

Which of these patterns have you seen succeed or fail in production? The theoretical elegance of event sourcing and sagas matters less than their operational reality in your specific context.

The Three Kubernetes Deployment Strategies That Actually Matter in Production

Rolling Updates Are Your Default, Not Your Only Option

Most teams stick with rolling updates because they’re the path of least resistance. Kubernetes handles the orchestration. Pods spin up gradually. Old ones terminate gracefully. Traffic shifts without drama. It works for 80% of production scenarios, which explains why so many engineers never explore alternatives.

The Three Kubernetes Deployment Strategies That Actually Matter in Production

But rolling updates have blind spots that’ll bite you when you least expect it. Database schema changes can break mid-deployment when new code hits old schemas. Stateful applications struggle with mixed versions running simultaneously. Cache invalidation becomes a nightmare when you have pods running different versions of your application logic.

Here’s the thing about treating rolling updates as your universal solution: they optimize for availability over correctness. Sometimes you need the opposite trade-off. Sometimes you need to guarantee that every user sees a consistent version of your application during the transition period. That’s where things get interesting.

Illustration for The Three Kubernetes Deployment Strategies That Actually Matter in Production

Blue-Green Deployments When You Need Atomic Switches

Blue-green deployments solve the consistency problem by maintaining two identical production environments. You deploy to the inactive environment, verify everything works, then switch traffic atomically. It’s elegant in theory and painful in practice if you haven’t planned for the infrastructure costs.

The math is straightforward but unforgiving. You need double the compute resources, double the storage, and double the network capacity during deployments. For applications with large persistent volumes or extensive caching layers, this translates to real money. I’ve seen teams abandon blue-green deployments after the first AWS bill arrived.

Blue-green deployments really shine with applications that have complex initialization procedures or strict consistency requirements. Think financial systems, inventory management, or any application where partial state updates create more problems than brief downtime. The ability to validate your entire stack before switching traffic is worth the infrastructure cost in these scenarios.

Implementation in Kubernetes requires careful service mesh configuration or ingress controller setup. You can’t just flip a switch in a deployment YAML file. You need to orchestrate the traffic routing, typically through tools like Istio, Linkerd, or specialized ingress controllers that support weighted routing. It’s more involved than it sounds.

Canary Deployments for Risk Management

Canary deployments sit in the middle ground between rolling updates and blue-green strategies. You route a small percentage of traffic to the new version while keeping the majority on the stable release. It’s risk management through gradual exposure rather than atomic switches.

The percentage split matters way more than most engineers realize. Starting with 1% traffic sounds conservative, but it’s often too small to detect subtle issues. Database connection pooling problems, memory leaks, or integration failures might not surface until you hit higher traffic volumes. I typically start at 5% and increase in 10% increments, monitoring error rates and response times at each step.

Kubernetes doesn’t provide native canary functionality, which pushes you into the service mesh world. Istio makes this relatively straightforward with VirtualServices and DestinationRules, but the configuration complexity increases dramatically. You’re no longer managing just deployments. You’re orchestrating traffic splitting, header-based routing, and potentially circuit breaking.

The monitoring requirements for canary deployments are absolutely non-negotiable. You need real-time metrics comparing error rates, latency percentiles, and business metrics between versions. Automated rollback triggers based on these metrics prevent small problems from becoming large incidents. Without proper observability, canary deployments become elaborate ways to slowly break production.

Feature Flags Change the Game Entirely

Feature flags decouple deployment from release in ways that make traditional deployment strategies feel primitive. You deploy code with features disabled, then enable functionality through configuration changes. It’s deployment strategy as software design pattern rather than infrastructure orchestration.

The implementation complexity moves into your application code instead of your deployment pipeline. You need flag evaluation logic, fallback mechanisms, and careful state management. But the operational benefits are substantial. Rollbacks become configuration changes rather than redeployments. You can test features on subsets of users without complex traffic routing. Emergency fixes bypass the entire deployment process.

Feature flags work exceptionally well with rolling updates because they eliminate the mixed-version consistency problems. Every pod runs the same code; only the feature configuration differs. This simplifies your deployment pipeline while providing more sophisticated release control than infrastructure-based strategies.

The downside? Technical debt accumulation. Flag cleanup requires discipline that most teams lack. I’ve debugged production issues caused by flag evaluation logic that should have been removed months earlier. Successful feature flag implementations require governance processes and automated cleanup procedures, not just the initial integration.

Choosing Strategy Based on Application Architecture

Your application architecture constrains your deployment strategy choices more than operational preferences. Microservices with database-per-service patterns work well with independent rolling updates. Monoliths with shared databases often require blue-green approaches for schema changes. Event-driven systems might need canary deployments to validate message processing behavior under load.

State management becomes the determining factor in most decisions. Stateless applications give you maximum flexibility. Any strategy works. Applications with local state benefit from blue-green deployments that avoid mixed-version coordination problems. Shared state applications, particularly those with caching layers, often require careful canary rollouts to detect cache coherency issues.

The human factor matters as much as the technical constraints. Rolling updates require minimal operational overhead but offer limited rollback capabilities. Blue-green deployments demand infrastructure investment but provide clean rollback paths. Canary deployments need sophisticated monitoring but offer granular risk control. Feature flags require development discipline but provide maximum flexibility.

There’s no universally correct answer, which is why this decision causes so much debate in architecture reviews. The right strategy depends on your specific application characteristics, operational maturity, and risk tolerance. Most production environments end up using different strategies for different services rather than standardizing on a single approach.

What deployment strategies have you found most effective in your production environments? The edge cases and failure modes are where the real learning happens, and I’m always interested in hearing about the scenarios that forced teams to reconsider their approaches.

Event Sourcing Isn’t the Silver Bullet You Think It Is

The Honeymoon Phase Always Ends

I’ve watched more teams fall in love with event sourcing than I care to count. The pattern looks beautiful on whiteboards. Immutable events. Perfect audit trails. Time travel debugging. What’s not to love? Then reality hits around month six when your event store has grown to 500GB and simple queries take thirty seconds to complete.

Event Sourcing Isn't the Silver Bullet You Think It Is
Event Sourcing Isn’t the Silver Bullet You Think It Is

Event sourcing works brilliantly for specific use cases. I’ve seen it solve complex domain problems that would have been nightmares with traditional CRUD operations. But I’ve also seen it turn straightforward business logic into Rube Goldberg machines that need a PhD to understand. The difference? Knowing when the complexity trade-off actually pays off.

Here’s the uncomfortable truth: most applications don’t need event sourcing. They need good old-fashioned normalized databases with proper indexing and maybe some caching on top. Before you architect your next system around events, ask yourself this: do you actually need to replay your entire application state from the beginning of time, or do you just want better audit logging?

Illustration for Event Sourcing Isn't the Silver Bullet You Think It Is
Illustration for Event Sourcing Isn’t the Silver Bullet You Think It Is

CQRS Without Event Sourcing Is Usually Enough

Command Query Responsibility Segregation gets bundled with event sourcing so often that developers think they’re married. They’re not. CQRS solves a different problem: optimizing reads and writes separately. I’ve built systems where CQRS delivered massive performance gains while keeping the persistence layer refreshingly boring.

Take an e-commerce platform handling thousands of concurrent users browsing products while orders trickle in at a much lower rate. Your read models need denormalized data optimized for search and filtering. Your write models need transactional consistency and business rule enforcement. CQRS lets you optimize both without the operational overhead of rebuilding state from events.

The write side can use traditional relational patterns with proper foreign keys and constraints. The read side can be NoSQL documents, search indexes, or whatever structure makes queries fast. You sync between them using reliable message queues or database triggers. Simple. Debuggable. Scalable.

Microservices Boundaries Matter More Than Your Framework Choice

I’ve debugged distributed systems built on everything from raw TCP sockets to the latest service mesh tech. The technology stack rarely determines success or failure. Bad service boundaries will kill your system whether you’re running on Kubernetes or bare metal.

The hardest lesson I learned came from a microservices migration that took eighteen months instead of six. We carved up a monolith based on technical concerns rather than business domains. Services that should have been talking internally ended up making network calls for operations that used to be simple method calls. Latency exploded. Data consistency became a constant battle.

Domain-driven design isn’t just academic theory. It’s practical guidance for where to put service boundaries. Services should own their data and expose behavior, not just CRUD operations over network APIs. When you find yourself coordinating multiple services for simple business operations, you’ve drawn the boundaries wrong.

Start with bigger services than you think you need. You can always split them later when you understand the domain better. But merging services after you’ve built separate deployment pipelines, monitoring systems, and teams around them? That’s organizational surgery without anesthesia.

Eventual Consistency Requires Careful Design

Distributed systems force you to choose between consistency and availability. Most developers nod along with this statement but don’t truly understand what it means until they’re debugging phantom inventory in production at 2 AM.

Eventual consistency isn’t a binary choice. It’s a spectrum of trade-offs that you need to make explicitly for each piece of data in your system. User profiles can be eventually consistent across regions. Financial transactions usually can’t. The key is designing your system so that temporary inconsistencies don’t break core business flows.

I’ve seen teams implement saga patterns for simple workflows that could have been handled with optimistic locking in a single database. Sagas add complexity. They need careful error handling, compensation logic, and monitoring. Use them when you need cross-service transactions, not because they sound sophisticated.

When you do embrace eventual consistency, make it visible to users. Don’t pretend the system is immediately consistent when it’s not. Show progress indicators. Acknowledge when operations are pending. Give users confidence that their actions are being processed even if the effects aren’t immediately visible.

Operational Complexity Compounds Quickly

Every architectural pattern you add increases your operational surface area. Event sourcing means managing event store performance and retention policies. CQRS means keeping read and write models synchronized. Microservices mean orchestrating deployments across multiple services. The complexity isn’t just additive, it’s multiplicative.

I’ve watched teams spend more time maintaining their distributed architecture than building features. They became experts in Kafka partition rebalancing instead of their actual business domain. There’s nothing wrong with that if you’re building infrastructure products, but most applications exist to solve business problems, not demonstrate architectural sophistication.

Start simple. Add complexity only when you have concrete evidence that simpler approaches won’t work. Measure everything. If you can’t explain why a particular architectural choice exists in terms of specific performance requirements or business constraints, you probably don’t need it.

The best distributed systems I’ve worked with feel boring to maintain. They handle millions of requests without drama. They fail gracefully when components go down. They scale predictably when load increases. Boring is good. Boring means you’re solving business problems instead of infrastructure problems.

What architectural decisions have you questioned after living with them in production? I’d love to hear about the complexity trade-offs that surprised you, either positively or negatively.

Page 9 of 12

Powered by WordPress & Theme by Anders Norén