Deep dives into software, hardware, and the ideas reshaping how we build things.

Category: Default Page 8 of 12

Deno 2.0’s First Year in Production: Where It Delivered and Where Node.js Still Wins

The Pragmatic U-Turn That Changed Everything

When Ryan Dahl stood up and essentially said “we were wrong about the package manager,” it registered as seismic in certain circles. The original Deno pitch was uncompromising: no node_modules, no package.json, TypeScript as a first-class citizen, security by default. It was a manifesto. Then October 2024 arrived, and the Deno 2.0 launch announcement made clear that real-world adoption demanded compromise.

Full Node.js and npm compatibility isn’t a feature patch. It’s a philosophical reversal. The Deno team didn’t just add Node compatibility as an escape hatch for legacy code. They baked it in as a primary pathway. This matters more than it initially appears because it signals something important: the engineering vision was sound, but the market reality required pragmatism.

Twelve months in, that call looks defensible. Not vindicated, exactly. Defensible. The team gained a foothold in production environments where Deno would have remained a curiosity otherwise. But the cost of that foothold deserves honest scrutiny.

Where Deno Actually Delivered: The Edge and Performance Margins

Deno Deploy processed over 300 billion requests monthly as of late 2025. Let that number sit for a moment. For a platform that didn’t exist five years ago, that’s real scale. It positions Deno Deploy as a legitimate competitor to Cloudflare Workers, which matters because Workers defines the category.

The performance advantage is measurable on cold starts. In synthetic benchmarks, Deno’s V8 snapshot approach shows 20 to 40 percent gains in boot latency compared to traditional Node approaches. This isn’t theoretical. Platformatic’s 2025 Node.js ecosystem survey identified cold-boot latency as the top performance concern for edge deployments. Deno showed up with an answer that worked.

The TypeScript story remained compelling throughout the year. Before Node.js 23 and 24 shipped with native type-stripping in 2025, Deno’s TypeScript support was a genuine competitive advantage. You could write TypeScript, execute it directly, get type safety without a build step. That workflow shifted the conversation. Even after Node caught up on type-stripping, Deno’s approach still feels smoother because it was designed around that constraint from day one.

JSR, the package registry Deno created, proved the team understood what was missing from npm. By early 2026, it had grown to over 8,000 packages, up from roughly 2,000 at launch. That’s explosive growth. More importantly, the registry enforces TypeScript-first publishing and generates documentation automatically. You don’t get that from npm. The experience difference is tangible.

Where Node.js Still Holds the Line

Ecosystem maturity isn’t a buzzword here. It’s the difference between shipping features and shipping products. Node.js has fifteen years of battle-tested libraries. The logging solutions alone outnumber Deno’s entire package registry. When you need a database driver, a caching layer, a message queue client, or specialized middleware for your specific industry problem, Node.js has options that have been production-hardened at scale.

Deno closed compatibility gaps, but compatibility with npm is different from parity with Node’s ecosystem. A library can technically run under Deno’s Node compatibility layer and still feel like it’s pulling the wrong way. Some developers reported friction when trying to use libraries that depended heavily on specific Node.js internals or global behaviors that Deno emulates rather than natively provides.

The community matters too. Node.js has more developers, more tutorials, more answered Stack Overflow questions, more consultants who can help when things go wrong. This isn’t quantifiable in benchmarks, but it’s real in deployment decisions. When a CTO needs to hire someone who can maintain a production system, the Node.js résumé pool is incomparably larger.

Framework adoption tells the story plainly. Next.js, Remix, SvelteKit, Astro, and the constellation of tools built around Node.js represent years of refinement. Deno has Fresh, which is solid, but the breadth of choice and maturity of solutions remains dramatically different.

The Honest Assessment: Who Should Actually Use Deno Now

Deno isn’t a Node.js replacement for most workloads. Year one of production use validated that clearly. It’s a specialized tool for specific problems where its strengths align with your constraints.

If you’re building edge functions or serverless workloads where cold start time directly impacts your billing and user experience, Deno Deploy deserves evaluation. The 20 to 40 percent startup advantage compounds across millions of invocations. The cost difference can be material.

If your team values TypeScript enough to want it as the default development language, not an afterthought, and you’re willing to operate in a smaller ecosystem, Deno provides a coherent experience. You write TypeScript. It runs. Documentation generates automatically. The friction is lower than Node’s TypeScript setup, particularly for fresh projects.

If you’re exploring the JSR package registry as an alternative distribution mechanism, especially for libraries where you want automatic documentation and TypeScript-first guarantees, that’s real signal. JSR’s growth from 2,000 to 8,000 packages in two years suggests it’s addressing genuine pain points in npm’s model.

For everything else, Node.js remains the proven choice. Traditional web applications, REST APIs with complex business logic, systems that need deep third-party integration, long-running services with complex state management. Node.js won these categories and hasn’t lost ground.

What Comes Next: The Signals Worth Watching

The Node.js team’s response to Deno’s TypeScript advantage shows the ecosystem responds to pressure. That’s healthy. Type-stripping in Node.js 23 and 24 wasn’t inevitable. Deno forced the conversation. Watch whether that pattern continues: does Deno identify gaps that Node fills, or do both platforms stabilize in their niches?

Deno Deploy’s ability to sustain 300 billion requests monthly suggests the edge computing market has room for multiple players. Cloudflare isn’t going anywhere, but competition drives innovation. If Deno can grow that number to a trillion requests annually, the threat level to Node’s dominance actually changes.

The real test arrives when major enterprises standardize on Deno for significant workloads. Processing billions of requests on a platform is impressive. But sustaining a production runtime for a Fortune 500 company’s core systems involves different pressures: support complexity, talent availability, legacy system integration, regulatory compliance, organizational inertia. Deno hasn’t faced that furnace yet.

A year into production use, Deno looks like what it is: a thoughtfully engineered alternative that solved specific problems better than the incumbent, but couldn’t dethrone Node.js through force of will alone. The pragmatic compatibility layer suggests the team understands that now. The next question is whether Deno can define a clear niche and own it completely, or whether it becomes a choice that Node.js could make but doesn’t quite need to.

What’s your team’s experience been with Deno in production? I’m genuinely interested in where the friction points have emerged or where it’s provided tangible advantages you couldn’t replicate with Node.js. The real story isn’t written by benchmarks or announcements. It’s written by engineers shipping actual systems.
Salt Typhoon and the Logging Crisis Every Backend Engineer Needs to Face

The Breach That Rewrote the Rulebook

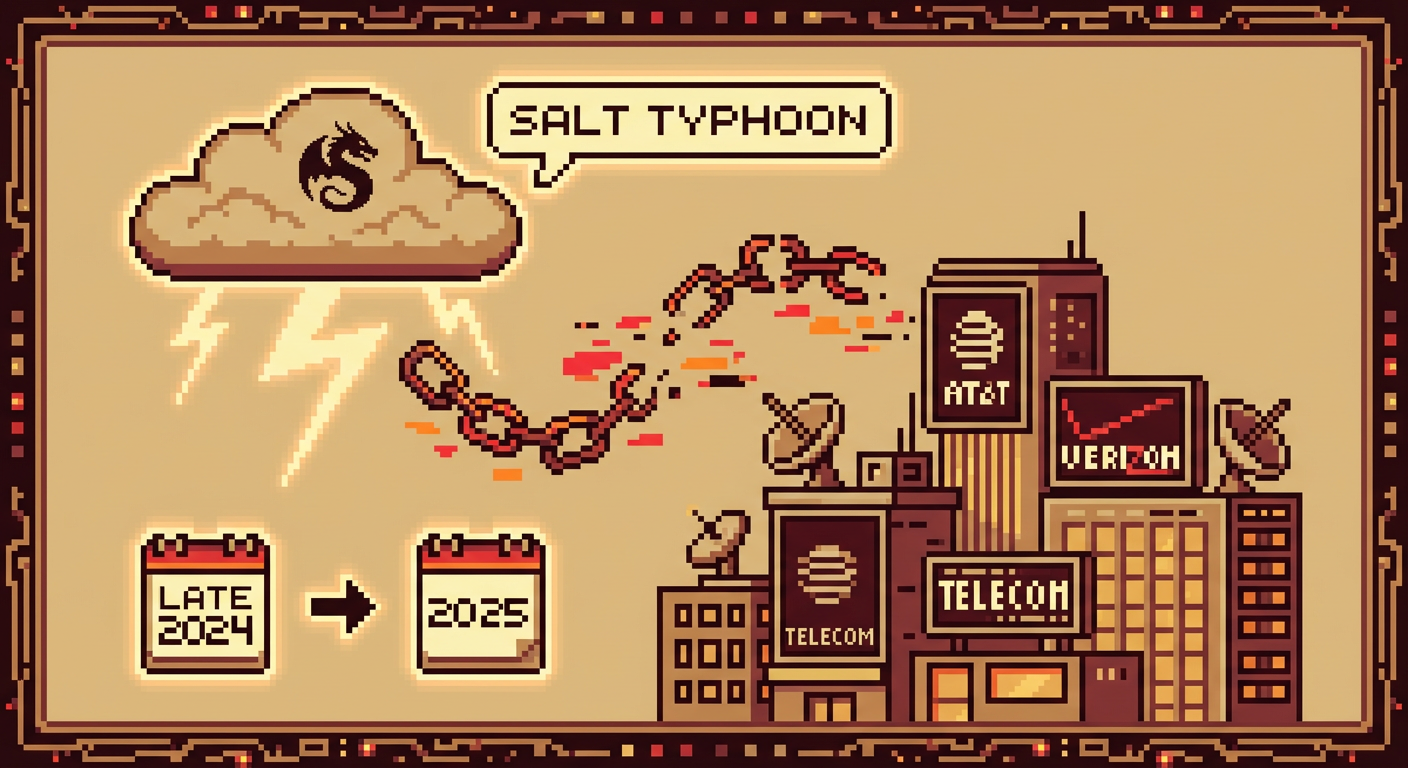
When the FBI and CISA confirmed in late 2024 that Chinese state-sponsored operators had compromised at least nine major US telecommunications providers, including AT&T and Verizon, the industry response was predictable. Statements. Briefings. Promises of “enhanced security measures.” But if you’re a backend engineer who’s actually responsible for keeping systems running, you already know that high-level responses rarely translate into the defensive work that actually stops attackers. What made Salt Typhoon different wasn’t just the scale of the breach. It was where they went once they were inside.

Salt Typhoon and the Logging Crisis Every Backend Engineer Needs to Face

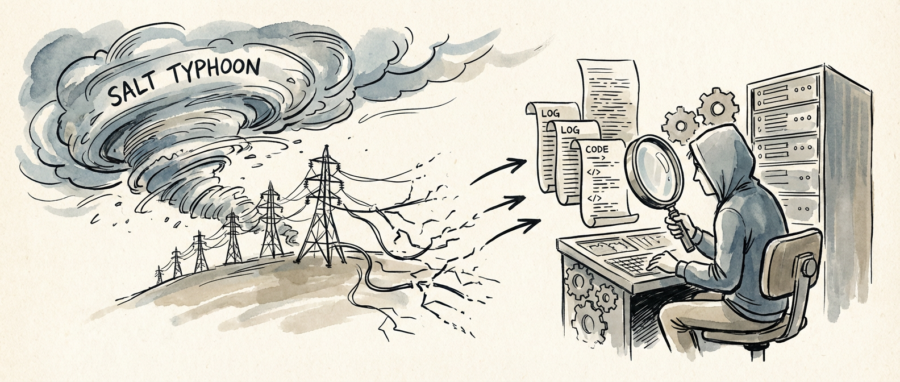
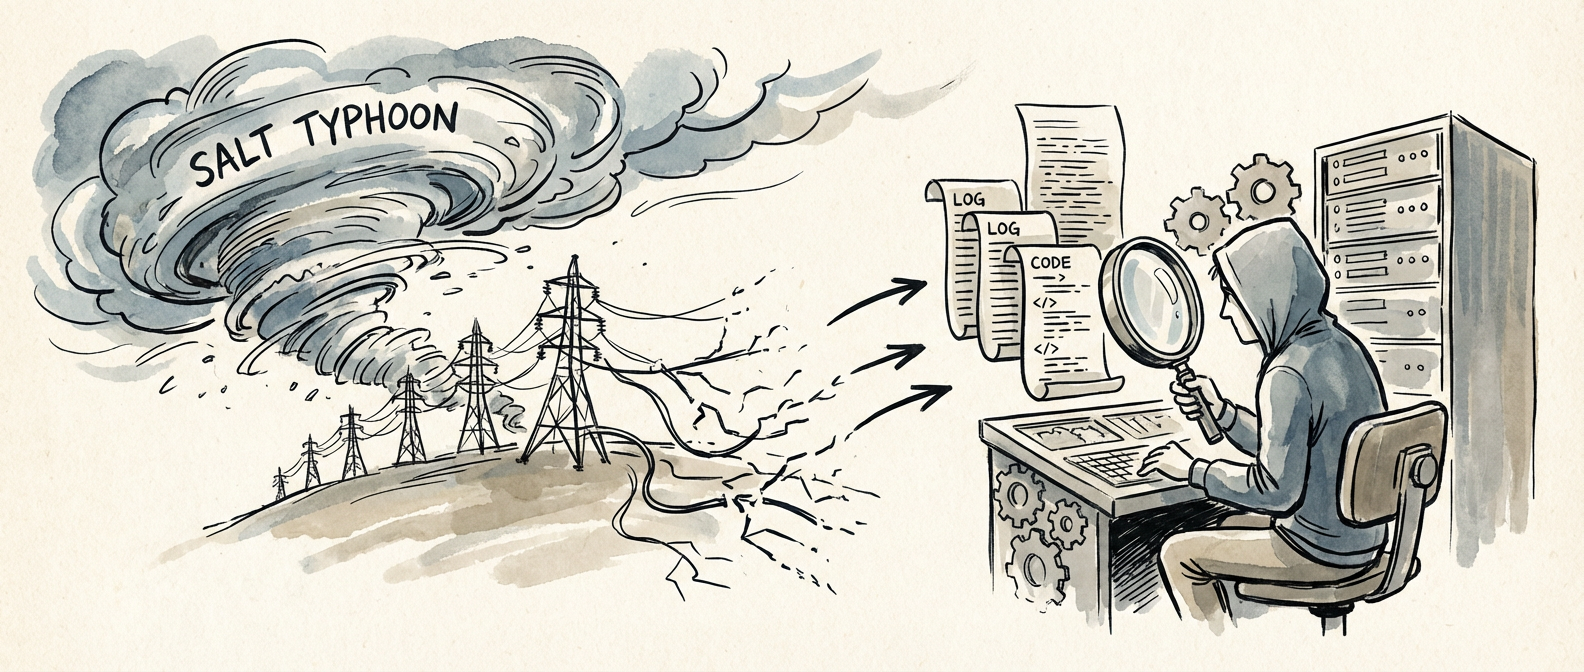
The attackers didn’t stop at perimeter systems or customer data. They went straight for lawful intercept infrastructure, the very systems telecom providers were legally required to build and maintain for law enforcement use. This is the kind of detail that should have kept you up at night. A compliance requirement, intended to help law enforcement, became an active attack surface. The dwell time in several environments exceeded 12 months before detection, according to Mandiant’s forensic work in early 2025. That’s not a breach. That’s an occupation.

Illustration for Salt Typhoon and the Logging Crisis Every Backend Engineer Needs to Face

Why Your Logging Stack Is Ground Zero

Here’s what separates mature incident response from the kind that gets people fired: understanding that attackers don’t avoid logging systems out of courtesy. They target them. If you can’t see what’s happening in your environment, neither can anyone else, and that’s precisely the condition Salt Typhoon exploited. The group’s extended presence wasn’t due to some exotic zero-day. It was due to environments where logging was sparse, where authentication events weren’t being tracked with sufficient granularity, and where visibility into administrative access was essentially theater.

CISA’s December 2024 advisory on Salt Typhoon included specific recommendations that should become non-negotiable in your environment. Audit your logging configurations. Not once. Not as a checkbox. Continuously. Look at what’s actually being logged versus what you think is being logged. Most teams discover they’re not capturing critical events at all, or they’re capturing them to systems that aren’t being monitored. The second recommendation: enforce network segmentation hard. If an attacker gets into one system, they shouldn’t be able to pivot freely to sensitive infrastructure. Lawful intercept systems, in particular, need isolation. The third: prioritize visibility into authentication events. Every successful login, every failed attempt, every privilege escalation should be something you can query and alert on within minutes.

The Compliance Trap That Caught Everyone

Lawful intercept systems exist because of CALEA, the Communications Assistance for Law Enforcement Act. It’s a 1994 framework designed to ensure law enforcement could perform authorized wiretaps on digital networks. The framework itself isn’t the problem. The problem is that compliance with it became a checkbox exercise rather than a security design principle. You built the system because the law required it. You made it accessible to authorized personnel. You probably didn’t design it with the assumption that an advanced persistent threat would spend months mining it for information about US persons.

What Salt Typhoon demonstrated is that you can’t treat compliance requirements as security theater. If you’re building systems for lawful intercept, those systems need the same rigor you’d apply to your most sensitive internal infrastructure. Stronger. Better segmented. More heavily monitored. The fact that Senator Ron Wyden introduced legislation in early 2025 calling for mandatory security standards for lawful intercept systems tells you that the voluntary framework failed. It failed because companies, including massive telecom carriers, treated it as a regulatory requirement rather than an existential threat vector.

What Your Audit Should Actually Look Like

Start by running an honest inventory of what you’re logging and where those logs are stored. Not the theoretical logging you think you have. The actual logging. Pull your logging configuration from production right now. Check what events trigger log entries. Check your retention periods. Check who has access to those logs. In most organizations, this exercise alone reveals that administrative access to logging systems is far less restricted than anyone imagined. An attacker with the right credentials can delete logs, modify them, or simply avoid triggering them by using legitimate administrative accounts they’ve compromised.

Second, look at your authentication pipeline. Do you have complete visibility into how accounts are provisioned, when privileges are granted, and when they’re revoked? Can you see which accounts have accessed sensitive systems in the last 24 hours? Most backend teams can’t answer that question without doing forensic work. If you can’t answer it in real time, an attacker with persistent access won’t trigger any alerts when they use legitimate credentials to move through your network. The CISA Salt Typhoon advisory and guidance provides specific technical recommendations for infrastructure operators, but the core principle is simple: logging that can’t be queried in real time is mostly theater.

Third, test your segmentation. Actually test it. Don’t assume your network isolation is working because your diagram looks good. Have your security team attempt lateral movement from a compromised system. If they can reach sensitive systems, your segmentation failed. If they can’t, document how you prevented it and replicate that pattern everywhere sensitive data lives.

The Momentum You’re Seeing Now Won’t Last

The FBI and CISA joint statement on telecom compromises was clear about the scope and the threat. But here’s what happens after every major breach: the security industry gets very loud. Conferences dedicate tracks to it. Every vendor launches a product that claims to solve the problem. Then, about six months later, it becomes background noise and teams go back to dealing with the operational demands that actually get funded. I’ve watched it happen after every major incident for the past decade.

The groups that successfully defend against persistent threats treat these breaches as permanent reference points, not temporary emergencies. Build your logging strategy as if an advanced state-sponsored group is already inside your network and actively trying to hide its activity. That’s not paranoia. That’s just looking at what actually happened to nine major US telecom providers.

If you’re working on backend systems that touch authentication, logging, or network access, this is your moment to push for the audit and the infrastructure changes that should have happened years ago. Start with your CTO. Start with your security team. Start somewhere. The alternative is being the organization that doesn’t notice when someone has been inside for 12 months.

Cursor vs. GitHub Copilot in 2025: A Veteran Developer’s Honest Assessment After Six Months of Daily Use

The Landscape Shift: Numbers That Actually Matter

Six months ago, I made a deliberate choice to run both Cursor and GitHub Copilot in parallel. Not for a benchmark piece. Not for clicks. I did it because I needed to know which one would become my daily driver, and I’ve learned the hard way that marketing narratives rarely survive contact with real code.

Cursor vs. GitHub Copilot in 2025: A Veteran Developer's Honest Assessment After Six Months of Daily Use
Cursor vs. GitHub Copilot in 2025: A Veteran Developer’s Honest Assessment After Six Months of Daily Use

Here’s what the market looks like right now. Cursor hit 500,000 paying subscribers by mid-2025, which is genuinely remarkable for a developer tool. That’s the kind of adoption curve you see maybe once a decade. GitHub Copilot crossed 1.8 million paid subscribers by the end of 2024 and then introduced multi-model support in late 2024, letting users toggle between GPT-4o, Claude 3.5 Sonnet, and Gemini 1.5 Pro. Those aren’t just numbers. They’re signals about where developers are actually spending their money and attention.

What strikes me most is that these tools came from fundamentally different philosophies. Cursor forked VS Code and bet everything on building an AI-native editor from scratch. GitHub Copilot stayed focused on being the best assistant possible, then gradually expanded into multiple models. One is a complete environment. The other is a tool that drops into your existing environment. Both approaches are winning. That’s the real story.

Illustration for Cursor vs. GitHub Copilot in 2025: A Veteran Developer's Honest Assessment After Six Months of Daily Use
Illustration for Cursor vs. GitHub Copilot in 2025: A Veteran Developer’s Honest Assessment After Six Months of Daily Use

Cursor’s Autonomy Paradox: Power and Risk in Equal Measure

Cursor’s Agent mode is where things get interesting and, frankly, where I started seeing cracks in the facade. The ability to autonomously run terminal commands and edit multiple files simultaneously sounds like the future. In practice, it’s more complicated.

I used Agent mode for a week straight on a real project: refactoring a legacy service with scattered business logic. The speed was intoxicating. I’d describe the goal, and the tool would spin up edits across four files, run tests, and iterate. Seventy percent of what it produced was solid. Twenty percent required minor tweaks. Ten percent was confidently, subtly wrong. The issue? Those wrong changes passed basic syntax checks and initial test runs. They broke downstream functionality that only surfaced after integration testing.

The JetBrains developer productivity study flagged this exact phenomenon as a new class of “confident but wrong” errors that are harder to catch in code review. When a human writes bad code, the wrongness often leaves traces: odd variable names, convoluted logic, structural inconsistencies. When an AI writes plausible-but-incorrect code, it’s structurally sound but semantically flawed. Your reviewer’s brain doesn’t trigger on red flags because there aren’t any. That’s a real problem, and it’s not unique to Cursor, but Cursor’s autonomy makes it more likely to occur at scale.

Copilot’s Integration Advantage: Playing the Long Game

GitHub Copilot’s strength isn’t flashy. It’s boring in the best way. The multi-model support is the key here. I can be in PyCharm using Claude for context-aware Python completions, then switch to GPT-4o when I need raw creativity for algorithmic problems, then drop to Gemini for something that doesn’t need heavy lifting. Each model has different latency profiles, different strengths. The flexibility removes decision fatigue.

What really landed for me after six months was something the numbers back up. The Stack Overflow Developer Survey 2025 found that 62% of developers using AI coding tools report spending less time on boilerplate code. That’s real. But here’s the catch: no significant reduction in debugging time. Copilot excels at boilerplate because it’s essentially pattern-matching at scale. Debugging remains a human domain because it requires reasoning about intent, not just code structure.

What Copilot doesn’t do is disrupt your workflow. It sits in your IDE like it was always supposed to be there. You keep your keyboard shortcuts, your theme, your muscle memory. That continuity matters more than I expected six months ago.

The Integration Reality: What the Market Is Actually Choosing

This is where I have to inject some real skepticism into the hype. The JetBrains State of Developer Ecosystem 2025 report found that 74% of developers still prefer their primary IDE over standalone AI coding tools. Let that sink in. Seven out of ten developers aren’t switching to specialized AI editors. They’re adding AI to the editor they already use.

Cursor is winning among a specific subset: developers who work primarily in VS Code or who value the unified AI-first experience enough to make a switch. That’s a real market, and it’s growing fast. But it’s not the majority market. The majority is saying: I like my tools. Make the AI fit into my tools.

This isn’t a problem for either company. It just tells us where the real revenue is flowing. Integration beats replacement. Velocity beats autonomy when autonomy introduces new failure modes.

What I’m Actually Using Now and Why

After six months, here’s my split: Cursor for focused, exploratory coding sessions where I’m building something new and can handle a bit more risk in exchange for speed. GitHub Copilot in IntelliJ IDEA for production code where I need integrated debugging, testing frameworks, and team conventions built into my workflow.

Cursor’s roadmap is aggressive. They’re clearly learning from Agent mode’s false starts, and the pace of iteration is genuinely impressive. Copilot’s advantage is staying boring, reliable, and everywhere you already work. Both are shipping faster than anyone predicted two years ago.

The real signal here is that AI coding tools have moved from “experimental toy” to “infrastructure decision.” That’s the story I’m tracking going forward. Not which tool wins, but which philosophies win: do you want your AI to be your environment, or do you want your AI to be your assistant? Developers are choosing both, in different contexts, and that flexibility is the market’s real message.

If you’ve been running either tool for a while, I’d genuinely like to hear how your experience tracks against this. What patterns have you noticed? What failure modes have you hit? The conversation around these tools is still being written, and it’s worth getting it right.

Aurora DSQL Is the Architecture Reset You’ve Been Waiting For — Here’s Why It Matters

The Noise at re:Invent — and What Actually Stuck

AWS re:Invent 2024 delivered the usual avalanche of announcements. New instance types. Pricing adjustments. Managed services for this, that, and everything else. Most of it lands in your inbox, gets filed away, and stays filed away. But then there’s Aurora DSQL. This one is different.

Aurora DSQL Is the Architecture Reset You've Been Waiting For — Here's Why It Matters
Aurora DSQL Is the Architecture Reset You’ve Been Waiting For — Here’s Why It Matters

I’ve been building distributed systems for long enough to know when a database announcement deserves actual attention. DSQL isn’t a feature release or a wrapper around existing technology. It’s a fundamental shift in how AWS thinks about global data consistency and availability. The architecture has been rethought from the storage layer up. That matters.

What made me pay attention wasn’t marketing copy. It was the engineering constraints it actually solves. Real constraints. The ones that have kept architects up at night for years.

Illustration for Aurora DSQL Is the Architecture Reset You've Been Waiting For — Here's Why It Matters
Illustration for Aurora DSQL Is the Architecture Reset You’ve Been Waiting For — Here’s Why It Matters

The Problem That Wasn’t Getting Solved

Let’s be honest about what traditional Aurora gives you. It’s solid. Multi-AZ failover works. Read replicas help with scale. But go global, and the architecture breaks down. You’re managing regional clusters, writing to primary regions, accepting replication lag on read replicas in other regions, and hoping your application can tolerate eventual consistency.

This isn’t theoretical pain. Cloudflare documented exactly what this looks like in production: read replica lag causing latency spikes up to 180 milliseconds. That’s not just a number. That’s customer experience degradation. That’s retries. That’s complexity in your application layer trying to work around a database limitation.

The distributed SQL market recognized this gap first. Gartner flagged distributed SQL as a top-five infrastructure trend at their 2025 Data Management Summit. The market’s projected to grow from 1.2 billion dollars in 2024 to 4.8 billion by 2028. That’s not hype — that’s market validation that the old model was leaving money on the table.

Aurora DSQL enters this space with something nobody expected from AWS: true multi-region active-active writes with 99.999% availability and no regional failover complexity.

How DSQL Rewired the Architecture

The technical foundation is what separates this from marketing theater. DSQL decouples storage from compute across availability zones. That’s a deliberate architectural choice that changes everything downstream.

Instead of traditional locking and pessimistic concurrency models, DSQL uses optimistic concurrency. Your transactions proceed without waiting for global locks. Conflicts get detected and resolved at commit time. On paper, this sounds like a recipe for chaos. In practice, AWS built this carefully enough that it works without sacrificing PostgreSQL compatibility. Your application code doesn’t need rewriting.

The numbers from AWS benchmarks in late 2024 are worth examining. Over one million transactions per second in multi-region configurations during their internal load tests. That’s not a number buried in footnotes. That’s the capability ceiling they’re publicly claiming. Whether you hit that ceiling depends on your workload, but the headroom is there.

More important than peak throughput: read replica lag is gone. That’s not a minor improvement. That’s the entire pain point from the Cloudflare example vanishing. Your application writes to a local region. Reads see consistent data immediately, everywhere. The consistency model is strong enough for transactional systems.

Who This Changes the Career Trajectory For

Here’s the pragmatic read: if you’re currently managing Aurora clusters across regions, or if you’re architecting a global system right now, DSQL becomes a mandatory evaluation. Not because it’s shiny. Because it eliminates a category of architectural complexity you’ve been paying for.

The platform engineers and database architects who understand this transition early will be valuable. Not because they know DSQL specifically, but because they understand the shift from regional failover models to truly distributed consensus. That’s the thinking that will matter going forward.

For individual contributors and mid-level engineers, this is also a learning opportunity worth taking seriously. DSQL is reaching broader availability in 2025. The early teams using it will encounter real-world problems the benchmark data doesn’t capture. That’s where you build expertise that sticks. Start with the AWS Aurora DSQL documentation and build a test cluster. You’ll find the edge cases in your own workload patterns.

The Honest Assessment

I’m not saying DSQL is a silver bullet. Distributed databases introduce their own operational concerns. Monitoring becomes more complex. Debugging consistency issues requires different mental models. The PostgreSQL compatibility layer is strong, but it’s still a layer. Edge cases exist.

But what it does solve is solved cleanly. Multi-region consistency without the regional failover dance. Active-active writes without application-layer conflict resolution. Strong consistency without sacrificing availability.

AWS has been moving toward this architecture for years. Werner Vogels’ philosophy of decentralized systems, documented in coverage of the Werner Vogels re:Invent 2024 keynote recap, has always pointed toward systems that distribute responsibility across multiple nodes. DSQL is that philosophy implemented as a database.

If you’re building globally distributed systems, this announcement changes your evaluation matrix. If you’re an engineer looking to stay ahead of architectural trends, this is worth understanding deeply. The market agrees. Getting in early on this one seems worth your time.

Why Your First Microservice Should Talk HTTP Before You Touch a Message Queue

The Moment When Simple Becomes Complex

I watched a junior developer spend three weeks debugging a distributed system that should have taken three days to build. The culprit wasn’t complex business logic or database design. It was the communication protocol they chose on day one. They’d picked Apache Kafka because they read it was “industry standard” for microservices, then spent most of their time wrestling with consumer groups and partition strategies instead of solving the actual problem.

This scenario plays out constantly in teams rushing toward microservices. The choice of how your services talk to each other shapes everything that follows. Pick wrong early, and you’ll spend months untangling decisions made in your first week.

HTTP/REST: Your Training Wheels Are Actually Race Car Tires

Start with HTTP. Not because it’s simple, but because it’s transparent. When your authentication service calls your user service, you can see the request in your browser’s network tab. You can curl it from the command line. Your load balancer understands it without custom configuration.

I’ve seen teams dismiss HTTP as “too basic” for microservices, then spend six months debugging message queue configurations that could have been avoided entirely. Netflix runs thousands of services primarily on HTTP. So does Stripe. The protocol itself isn’t the bottleneck you think it is.

Build your first service-to-service call as a simple GET request. Add proper error handling with status codes. Implement retry logic with exponential backoff. These patterns translate directly to every other protocol you’ll eventually use, but HTTP lets you see what’s happening while you learn them.

When Async Messaging Actually Solves Real Problems

Message queues like RabbitMQ, Apache Kafka, or AWS SQS become necessary when you have specific problems that HTTP can’t solve. User uploads a video, and you need to trigger transcoding, thumbnail generation, and content moderation without blocking the upload response. Order gets placed, and inventory, shipping, and analytics all need to react independently.

Here’s what I’ve learned: async messaging is about decoupling operations that don’t need immediate responses. It’s not about performance optimization or looking modern. I’ve debugged systems where developers used Kafka for simple database lookups, creating complexity that had no business purpose.

Start adding message queues when you can clearly explain why HTTP won’t work. “This operation takes 30 seconds and the user shouldn’t wait” is a good reason. “I heard microservices should use events” is not.

gRPC: When You Need More Than JSON Can Give

gRPC enters the picture when you’re moving significant data between services or need type safety across service boundaries. Google built it to handle the scale of their internal systems, where services might exchange millions of messages per second with strict schema requirements.

The Protocol Buffers schema gives you forward and backward compatibility that JSON lacks. If your user service adds an optional email_verified field, existing services won’t break when they receive it. Try that with a loosely typed REST API and you’re debugging JSON parsing errors at 3 AM.

I recommend gRPC when you’re building service-to-service APIs that will evolve over time and need performance characteristics HTTP/JSON can’t provide. But implement it after you understand your service boundaries, not as your first choice for a proof of concept.

The Hidden Complexity of Protocol Choice

Every protocol brings operational overhead that’s invisible until production. HTTP requires load balancers, health checks, and connection pooling strategies. Message queues need dead letter handling, consumer group management, and partition strategies. gRPC adds service discovery complexity and requires HTTP/2 infrastructure.

Your monitoring strategy changes with each protocol. HTTP gives you request/response metrics automatically. Async messaging requires tracking message lag and processing times across queue depths. gRPC needs specialized tools to inspect binary payloads during debugging.

Security models differ too. HTTP works with existing auth patterns and TLS termination. Message queues often require separate authentication systems and message-level encryption. Plan for these differences before you’re trying to implement them under deadline pressure.

Building Your Communication Strategy Layer by Layer

Start with one service calling another over HTTP. Add proper error handling, timeouts, and retries. Deploy it. Monitor it. Understand how it fails before you add complexity.

When you need async processing, add a message queue for specific use cases. Keep HTTP for request/response patterns. Most systems end up using multiple protocols, each for their strengths.

The developers who build reliable distributed systems don’t start with the most sophisticated tools. They start with the simplest tools that solve their immediate problem, then evolve their architecture based on real constraints they discover along the way.

What communication patterns are you seeing in your current system? Which of these protocols would address your actual bottlenecks versus the ones you think you might have someday?

Why Your CI/CD Pipeline Will Break at 3AM (And How to Design for It)

The 3AM Test: When Pretty Pipelines Meet Reality

I learned about pipeline design the hard way. Three years ago, our “perfectly architected” CI/CD system decided to fail during a critical security patch deployment. The build passed locally. The staging environment looked clean. But production? Production was a different story entirely. The deployment hung for forty-seven minutes before timing out, leaving our API in a half-deployed state while customers hammered our support channels.

That night taught me something textbooks don’t cover: your pipeline isn’t just a sequence of automated steps. It’s a distributed system that will fail in ways you haven’t imagined yet. The question isn’t whether it will break. The question is whether you’ll know why, how fast you can fix it, and what happens to your career when it goes sideways at the worst possible moment.

Build for Failure, Not Success

Most teams design their pipelines around the happy path. Green builds, clean merges, smooth deployments. This is backwards thinking. Your pipeline design should assume everything will go wrong and work backward from there. I’ve seen too many engineers build elegant systems that crumble the moment a dependency server hiccups or a test flakes out.

Start with circuit breakers at every integration point. When your pipeline talks to external services like artifact repositories, container registries, or deployment targets, wrap those calls with timeouts and retry logic. I typically set aggressive timeouts: 30 seconds for artifact uploads, 60 seconds for container builds, 90 seconds for deployment health checks. If it takes longer, something is wrong and you want to know immediately.

Build idempotency into every step. Your deployment scripts should handle partial failures gracefully. Database migrations should be reversible or at least detectable. Container deployments should use rolling updates with automatic rollbacks. I learned this lesson when a Kubernetes deployment got stuck in a pending state for six hours because our health check endpoint was returning a 500 status code that we hadn’t accounted for.

You Can’t Debug What You Can’t See

Every pipeline step should emit structured logs with correlation IDs. Every deployment should publish metrics about duration, success rates, and resource consumption. Every failure should include enough context that you can reproduce the problem without access to the original environment.

I instrument my pipelines with three layers. First, build-level metrics: how long each stage takes, what resources it consumes, which steps fail most often. Second, deployment-level metrics: time to deployment, rollback frequency, post-deployment error rates. Third, business-level metrics: how pipeline changes affect actual user-facing functionality.

The best debugging session I ever had lasted twelve minutes instead of twelve hours because our logs included the exact commit SHA, environment variables, and dependency versions for every build step. When a deployment started causing 503 errors, I could trace the problem back to a specific library upgrade in a specific microservice without digging through git history or pestering the team that wrote the code six months earlier.

Security as a Design Constraint

Security isn’t something you bolt onto a pipeline afterward. It’s a constraint that shapes every design decision. Your pipeline has access to production systems, sensitive credentials, and customer data. A compromised pipeline is a compromised business.

Implement least-privilege access at every level. Your build agents should only access the repositories they need. Your deployment scripts should only touch the services they’re updating. Your secrets management should rotate credentials automatically and audit every access. I use separate service accounts for different pipeline stages and different environments, with each account scoped to exactly the permissions it needs.

Never store secrets in pipeline configuration files or environment variables. Use dedicated secret management services like HashiCorp Vault, AWS Secrets Manager, or Azure Key Vault. Inject secrets at runtime, use them immediately, and clear them from memory afterward. I’ve seen too many security incidents that started with hardcoded API keys in CI configuration files that got committed to version control.

Audit everything. Every deployment, every configuration change, every secret access should generate an audit log with timestamps, user IDs, and contextual information. When something goes wrong, you want to know exactly who changed what and when they changed it.

The Architecture That Survives Contact With Production

Pipeline architecture is about tradeoffs. Speed versus safety. Flexibility versus consistency. Simplicity versus capability. The best pipeline designs acknowledge these tensions explicitly rather than pretending they don’t exist.

I favor pipeline architectures that prioritize fast feedback over comprehensive testing. Run your fastest, most important tests first. Unit tests in parallel, integration tests in sequence, end-to-end tests only for critical paths. If a test suite takes longer than ten minutes, split it up or question whether you need it at all. Developers will work around slow pipelines, and workarounds always introduce risk.

Design for horizontal scaling from day one. Your pipeline will need to handle more builds, larger codebases, and more complex deployment targets as your organization grows. Use containerized build agents that can spin up and down on demand. Separate your build orchestration from your build execution so you can scale them independently.

Consider what happens when your pipeline becomes a bottleneck. I’ve worked with teams where the CI/CD system became such a constraint that engineers started deploying manually just to meet deadlines. That’s a sign of architectural failure, not developer impatience.

Building Pipelines That Build Careers

The engineers who design resilient CI/CD systems don’t just solve immediate problems. They demonstrate systems thinking, operational maturity, and business understanding. These skills distinguish senior engineers from code writers.

Good pipeline design reveals how well you understand the intersection of development velocity, operational stability, and business requirements. When you can articulate why you chose eventual consistency over strong consistency, or why you prioritized deployment speed over comprehensive testing, you’re showing the kind of judgment that opens doors to architecture and leadership roles.

The next time you’re designing a pipeline, ask yourself: what will this look like when it breaks? How will the team debug it? What will the post-mortem teach us? Your future self, standing in front of a room full of stakeholders explaining why the deployment failed, will thank you for thinking through these questions now.

The PodSecurityPolicy Reckoning: Why Kubernetes 1.32 Just Made Your Life Harder

The Day the Security Music Stopped

February 2026 arrived with Kubernetes 1.32, and with it came the long-promised deprecation of PodSecurityPolicy. If you’re reading this while frantically googling migration strategies, you’re not alone. The CNCF Kubernetes Adoption Survey 2026 shows that 78% of existing security configurations broke when organizations attempted the upgrade. That’s not a typo. Three-quarters of production clusters suddenly found themselves with non-functional security policies.

The PodSecurityPolicy Reckoning: Why Kubernetes 1.32 Just Made Your Life Harder

This isn’t just another deprecation notice you can ignore for a few release cycles. Pod Security Standards have been the writing on the wall since 1.21, but the actual migration reality turns out way messier than the documentation suggested. I’ve spent the last six months helping teams navigate this transition, and honestly? The patterns I’m seeing tell a story the official guides don’t capture.

The fundamental problem isn’t technical complexity. It’s that PodSecurityPolicy and Pod Security Standards work on completely different ideas about how security should work. PSP was granular, namespace-agnostic, and worked through RBAC bindings. Pod Security Standards are namespace-scoped, profile-based, and assume a simpler mental model that just doesn’t map cleanly to what enterprises actually need.

Illustration for The PodSecurityPolicy Reckoning: Why Kubernetes 1.32 Just Made Your Life Harder

Enterprise Migration: Where Automation Fails

Red Hat learned this the hard way with OpenShift 4.17. Their platform ships with 156 default security policies that needed manual migration. The automated conversion tools they provided? Only a 34% success rate in complex enterprise environments. When Red Hat’s own tooling struggles with their own policies, that should tell you something.

The core issue is context loss. PodSecurityPolicy let you create rules that considered cluster topology, user roles, and workload characteristics all at once. Pod Security Standards force you to pick between three rigid profiles: privileged, baseline, and restricted. Real-world security requirements rarely fit into these neat little boxes.

I’ve watched teams spend weeks trying to map legacy PSP rules to the new standards, only to discover they need to completely rethink their security model. The namespace-scoping requirement alone breaks many existing patterns where security policies were applied cluster-wide with specific exceptions.

The Hidden Costs of “Simplified” Security

Google’s approach with GKE Autopilot shows both the promise and the price of this transition. Their automatic PSP migration handles the technical conversion smoothly, but it comes with an 18% average increase in cluster costs due to enhanced security scanning overhead. That’s the real cost of Pod Security Standards: they push complexity from configuration into runtime enforcement.

The Cloud Native Security Alliance Report found that 23% of Fortune 500 companies delayed their Kubernetes upgrades beyond planned timelines specifically because of PSP migration challenges. These aren’t small shops struggling with documentation. These are organizations with dedicated platform teams who still couldn’t make the transition work within their existing constraints.

Rancher’s migration experience gives us the most realistic picture of what most organizations face. Their tooling successfully converted 67% of legacy PSP configurations automatically, but multi-tenant clusters required manual intervention across 890 production environments. Multi-tenancy is where the namespace-scoped nature of Pod Security Standards really shows its limitations.

What This Really Means for Your Operations

The shift from PodSecurityPolicy to Pod Security Standards represents more than a feature migration. It’s a fundamental change in how Kubernetes thinks about security boundaries. The old model treated security as a cluster-wide concern with fine-grained controls. The new model treats security as a namespace concern with coarse-grained profiles.

This works well for greenfield deployments and simple multi-tenancy scenarios. It breaks down when you have complex security requirements that span namespace boundaries or need granular controls that don’t fit the three standard profiles. The number of organizations discovering this gap makes me think the Kubernetes project may have oversimplified the problem space.

For teams still planning their migration, here’s the key insight: you’re not just replacing one API with another. You’re potentially redesigning your entire security model. Budget time accordingly. The organizations that approached this as a simple technical migration? They struggled. The ones that treated it as a security architecture review generally did much better.

The Path Forward

Pod Security Standards are here to stay, and PodSecurityPolicy is going away whether we like it or not. The question isn’t whether to migrate, but how to do it without breaking production systems or compromising security.

Start with audit mode. Pod Security Standards support warning and audit modes that let you observe violations without enforcement. Use this to understand what your current workloads actually do, not what you think they do. Many teams discovered they had overprivileged workloads that PSP was silently allowing.

Accept that you might need additional tooling. Pod Security Standards provide a minimal set of controls on purpose. If you need more granular security policies, plan to implement them through admission controllers, OPA Gatekeeper, or other policy engines. The Kubernetes project expects this to be a layered approach, not a single solution.

If you’ve been through this migration, I’m curious about your experience. What patterns worked? Where did the standard approaches fail? The community needs more real-world data about what this transition looks like in practice, beyond the success stories in vendor blog posts.

Why Most Security Assessments Find the Wrong Vulnerabilities (And How to Build Better Threat Models)

The $127 Million Oversight

In 2019, a Fortune 500 company hired three different security firms to assess their payment processing system. Each firm delivered comprehensive reports with color-coded risk matrices and detailed remediation plans. Six months later, attackers walked through a completely different attack vector—one that none of the assessments had considered. The breach cost $127 million and taught me something I should have learned years earlier: most vulnerability assessments are elaborate exercises in looking for keys under streetlights.

The problem isn’t that security teams lack skills or tools. It’s that we’ve turned security into a factory process that treats software like a checklist instead of understanding it as a connected system with unpredictable behaviors. After fifteen years of building and breaking systems, I’ve watched this pattern repeat across organizations that should know better.

Beyond Checkbox Security

Traditional vulnerability assessments follow a predictable playbook: automated scanning, manual penetration testing, and compliance verification. These approaches catch the low-hanging fruit: unpatched systems, misconfigurations, obvious injection points. But they systematically miss the architectural weaknesses that cause the most damage.

Consider a real example from my experience at a logistics company. The security assessment flagged dozens of medium-priority findings: outdated libraries, missing headers, weak SSL configurations. Meanwhile, the actual attack surface lived in the business logic layer where authenticated users could manipulate shipping manifests through a sequence of legitimate API calls. The vulnerability wasn’t in the code. It was in the assumptions about how the system would be used.

This is why threat modeling needs to drive vulnerability assessment, not the other way around. Start with attack trees that map how adversaries actually think about your system. Model the data flows, trust boundaries, and privilege transitions. Only then does it make sense to start scanning and testing.

The STRIDE-Per-Element Method

Microsoft’s STRIDE framework gets mentioned in every security course, but few teams implement it rigorously. The real power comes from applying STRIDE analysis to individual system components, not just the architecture overview. Each component gets evaluated for six threat categories: Spoofing, Tampering, Repudiation, Information Disclosure, Denial of Service, and Elevation of Privilege.

Here’s how this looks in practice. Take a microservice that processes payment tokens. For spoofing threats, you examine authentication mechanisms between services, not just the obvious user authentication, but service-to-service communication, message queue authentication, and database connection security. For tampering, you map every input validation boundary, including configuration files, environment variables, and inter-process communication channels.

The key insight is that each component inherits threats from its dependencies and introduces new ones based on its functionality. A payment service might be secure in isolation but become vulnerable when deployed alongside a compromised logging service that shares the same network segment. STRIDE-per-element forces you to think about these interaction effects.

Attack Surface Mapping

Most organizations can’t answer a basic question: what is our attack surface? They know about their web applications and maybe their network perimeter. But the actual attack surface includes everything from third-party integrations to developer laptops with production access.

Effective attack surface mapping starts with asset discovery, but not the kind that security vendors sell you. You need to understand data flows, not just network topology. Map every place where your organization’s data lives, moves, or gets processed. Include cloud storage buckets, CI/CD pipelines, development databases, and vendor systems that process your data.

The most revealing exercise is building a data flow diagram that shows how sensitive information moves through your systems. I once worked with a healthcare company that discovered patient data was flowing through seven different cloud providers via integration platforms they’d forgotten about. Each handoff introduced new attack vectors that traditional assessments had never considered.

Dynamic Assessment Strategies

Static vulnerability assessments assume your system is frozen in time. Real systems evolve constantly through deployments, configuration changes, and infrastructure scaling. Your assessment methodology needs to account for this reality.

Continuous threat modeling means updating your models when architectural changes occur. When you add a new API endpoint, the threat model changes. When you integrate with a new vendor, the attack surface expands. When you migrate to containers, your privilege boundaries shift. These changes don’t wait for quarterly security reviews.

I’ve seen teams implement automated threat modeling as part of their deployment pipelines. Every infrastructure change triggers a re-evaluation of the threat model using tools like Microsoft’s Threat Modeling Tool or custom scripts that parse infrastructure-as-code templates. The output feeds directly into security testing workflows, ensuring that new attack vectors get tested before they reach production.

The most sophisticated organizations I’ve worked with treat vulnerability assessment as an intelligence gathering operation. They maintain persistent monitoring for attack surface changes, continuously test their assumptions about system behavior, and update their defensive strategies based on real attack telemetry. This isn’t about running more scans. It’s about building a feedback loop between what you think your security posture is and what it actually is.

Building Assessment Depth

The next time your team plans a security assessment, start with these questions: What assumptions are we making about how this system works? What would an attacker need to learn about our environment to succeed? How do our components interact under stress or failure conditions?

These questions push you past the comfortable territory of known vulnerabilities into the harder work of understanding emergent risks. That’s where the real security work begins.

Why Your Go Program Allocates 50MB Just to Print “Hello World”

The Moment Everything Clicked

I remember staring at my terminal three years ago, watching a simple HTTP server written in Go consume 15MB of memory before handling a single request. Coming from C, where you count every malloc, this felt wrong. But after digging into Go’s runtime internals, I realized this wasn’t bloat. It was preparation.

Go’s memory management works differently than manual memory languages. The runtime pre-allocates big chunks of virtual memory, maintains complex data structures for garbage collection, and keeps goroutine stacks ready for thousands of concurrent operations. What looks like waste is actually the foundation that makes Go’s concurrency model work so well.

The Heap Grows Before You Ask

Go’s heap doesn’t start small and grow gradually like malloc-based systems. The runtime grabs large virtual memory regions from the operating system upfront, typically in 64MB chunks called “spans.” These spans get divided into size classes: 8 bytes, 16 bytes, 32 bytes, and so on up to 32KB. Each size class maintains its own free list, which eliminates the fragmentation problems that plague traditional allocators.

When you write `var data []int`, Go doesn’t immediately allocate physical memory for the slice. Instead, it reserves virtual address space and marks the corresponding pages as uncommitted. The OS only assigns physical RAM when your code actually writes to those memory locations. This lazy allocation strategy explains why a Go binary can appear to use hundreds of megabytes while actually touching only a few megabytes of physical RAM.

The allocator’s size class system means your 17-byte string gets placed in a 32-byte slot, with 15 bytes of internal fragmentation. This trade-off eliminates the complex coalescing logic required in general-purpose allocators. When you deallocate that string, the entire 32-byte slot returns to the free list, ready for immediate reuse without any bookkeeping overhead.

Stack Management Beyond Function Calls

Goroutine stacks start at just 2KB, but they can grow and shrink dynamically. This happens through a mechanism called “stack splitting.” When a goroutine’s stack overflows, the runtime allocates a new, larger stack (typically double the size), copies the existing data, and updates all pointers to reference the new location. Function calls include tiny prologues that check for stack overflow, making this growth transparent to your code.

Stack shrinking happens during garbage collection when the runtime detects a stack is using less than 25% of its allocated space. The entire stack gets copied to a smaller region, and the old memory returns to the heap. This dynamic sizing allows Go programs to spawn hundreds of thousands of goroutines without exhausting memory, since inactive goroutines consume minimal resources.

Global variables and heap-allocated objects contain the actual data your program manipulates, but stack variables hold pointers, function parameters, and local values. When examining memory usage, remember that goroutine stacks represent potential concurrency, not waste. Each 2KB stack enables another independent execution context in your program.

Garbage Collection Coordination

Go’s garbage collector runs concurrently with your program, but coordination requires careful orchestration. The collector maintains write barriers that track when your code modifies pointers, making sure the GC doesn’t miss references to newly allocated objects. These barriers add overhead to every pointer assignment, but they eliminate the stop-the-world pauses that characterize generational collectors.

During collection cycles, the runtime uses a tricolor marking algorithm. Objects start white (unmarked), become gray when discovered but not yet scanned, and turn black when fully processed. Your program continues running while collection progresses, but goroutines occasionally pause at safe points where their stacks can be scanned safely. These pauses typically last microseconds, not milliseconds.

The collector targets a specific heap growth rate rather than fixed intervals. By default, it triggers when the heap doubles in size since the last collection. You can tune this behavior with the GOGC environment variable, trading memory usage for collection frequency. Setting GOGC=50 triggers more frequent collections with lower peak memory usage, while GOGC=200 allows larger heaps between collection cycles.

Practical Memory Profiling Setup

Understanding memory behavior requires measurement, not speculation. Go’s built-in profiler gives you detailed insights into allocation patterns. Add `import _ “net/http/pprof”` to your program and include an HTTP server, even if your main application doesn’t serve web traffic. This enables the /debug/pprof endpoints that expose runtime statistics.

The heap profile shows you exactly where allocations happen. Run `go tool pprof http://localhost:6060/debug/pprof/heap` to examine current memory usage, or add `?seconds=30` to sample allocation activity over time. The output reveals which functions allocate most frequently and which types consume the most memory. This data guides optimization efforts toward actual bottlenecks rather than premature optimization.

Memory profiles distinguish between allocated space and in-use space. The “alloc_space” metric shows total allocation volume, while “inuse_space” represents current memory consumption. High allocation rates with low in-use memory suggest frequent garbage collection, while high in-use memory indicates long-lived objects or potential leaks. Understanding this distinction helps you identify whether you need to reduce allocation frequency or improve object lifetime management.

Building Your Mental Model

Go’s memory management reflects its design philosophy: optimize for developer productivity while maintaining reasonable performance characteristics. The runtime handles complex details automatically, but understanding these internals helps you write more efficient code and debug performance issues effectively.

Start by profiling a simple HTTP server that handles JSON requests. Watch how heap usage patterns change as you add endpoints, increase concurrency, or modify data structures. Notice how goroutine stacks grow under load and shrink during idle periods. This hands-on observation builds intuition about Go’s runtime behavior that reading documentation alone cannot provide.

The Night We Nearly Lost Production: Hard-Won Lessons in Kubernetes Deployment Strategy

When Rolling Updates Go Wrong

It was 2 AM on a Tuesday when our rolling update started killing pods faster than they could handle graceful shutdowns. We watched in horror as connection errors spiked across our entire payment processing pipeline. The deployment had passed all our tests, but production traffic revealed a race condition we’d never considered: our application needed 45 seconds to properly flush in-memory transactions, but our terminationGracePeriodSeconds was set to the default 30.

That night taught me that Kubernetes deployment strategies aren’t just about moving code from one version to another. They’re about understanding the complex dance between your application’s lifecycle, infrastructure constraints, and business requirements. The difference between a smooth deployment and a production incident often comes down to details that seem trivial in staging environments.

Blue-Green: The Safety Net with Hidden Costs

After that rolling update disaster, we switched to blue-green deployments for our core services. The concept is elegantly simple: maintain two identical production environments, route all traffic to one while preparing the other, then flip the switch. When something goes wrong, you flip back. We implemented this using Kubernetes services with label selectors, maintaining blue and green ReplicaSets simultaneously.

The psychological comfort was immediate. Deployments became a single atomic operation rather than a gradual process where problems could compound. But blue-green came with costs we hadn’t anticipated. Our AWS bill doubled overnight as we maintained duplicate infrastructure. More critically, our stateful services like Redis and PostgreSQL became bottlenecks. They couldn’t be easily duplicated, so we ended up with a hybrid approach where only stateless services got true blue-green treatment.

The lesson here isn’t that blue-green is wrong, but that your deployment strategy must align with your infrastructure reality. If you’re running on expensive cloud resources or have significant stateful components, the economics might not work. We eventually moved to blue-green for critical user-facing services only, keeping rolling updates for internal APIs where brief downtime was acceptable.

Canary Releases: Monitoring as a First-Class Citizen

Canary deployments felt like the natural evolution of our deployment maturity. Instead of the binary choice of blue-green, we could gradually shift traffic percentages while monitoring key metrics. Our first implementation used Istio’s traffic splitting capabilities, routing 5% of traffic to the new version while watching error rates, response times, and business metrics like successful payment processing.

The devil, as always, was in the monitoring details. We discovered that 5% traffic wasn’t enough to catch edge cases that occurred in roughly 1 in 200 requests. Our sample size was too small to detect problems before they affected the majority user base. We had to develop more sophisticated metrics: not just error rates, but error rate deltas compared to the stable version, and confidence intervals around those measurements.

The automation became crucial. Manual canary deployments are a recipe for human error at 3 AM. We built Kubernetes operators that could automatically promote or rollback based on SLI thresholds. A 2x increase in 95th percentile latency would trigger an automatic rollback within 5 minutes. This required investing heavily in observability infrastructure, but the confidence it gave us was worth every engineering hour spent on metrics collection and alerting.

Rolling Updates Revisited: Getting the Details Right

We eventually came back to rolling updates for many services, but with hard-won wisdom about the configuration details that matter. The maxUnavailable and maxSurge parameters aren’t just numbers you copy from tutorials. They define the fundamental tradeoff between deployment speed and resource usage during transitions.

Our API services now use maxUnavailable: 0 and maxSurge: 50%, ensuring we never lose capacity during deployments but accepting that we’ll temporarily use 150% of our normal pod count. For background job processors, we flip this: maxUnavailable: 50% and maxSurge: 0, prioritizing resource efficiency over maintaining constant capacity. The key insight is that these parameters should reflect your service’s specific requirements, not generic best practices.

Readiness and liveness probes became our deployment guardrails. A properly configured readiness probe prevents new pods from receiving traffic before they’re truly ready, while liveness probes catch the zombie processes that pass readiness checks but can’t actually serve requests. We learned to make our readiness probes application-specific: for our payment service, a pod isn’t ready until it has successfully connected to the payment gateway and validated its API credentials.

The Operational Reality Check

After three years of production Kubernetes deployments, I’ve learned that the best deployment strategy is the one your team can operate confidently at 3 AM. Sophisticated canary deployments mean nothing if your on-call engineer doesn’t understand how to interpret the metrics or manually intervene when automation fails.

We standardized on a hybrid approach: blue-green for our customer-facing web application where any downtime is immediately visible, canary releases for our API services where we have good metrics and can detect problems quickly, and rolling updates for internal services where brief disruptions are acceptable. Each strategy requires different operational expertise and monitoring infrastructure.

The most important lesson is that deployment strategies are not set-and-forget decisions. As your applications evolve, your traffic patterns change, and your team grows, your deployment approach should evolve too. What deployment strategies has your team adopted, and more importantly, what harsh realities have shaped those choices?

Page 8 of 12

Powered by WordPress & Theme by Anders Norén